Free Access
Fig. 5
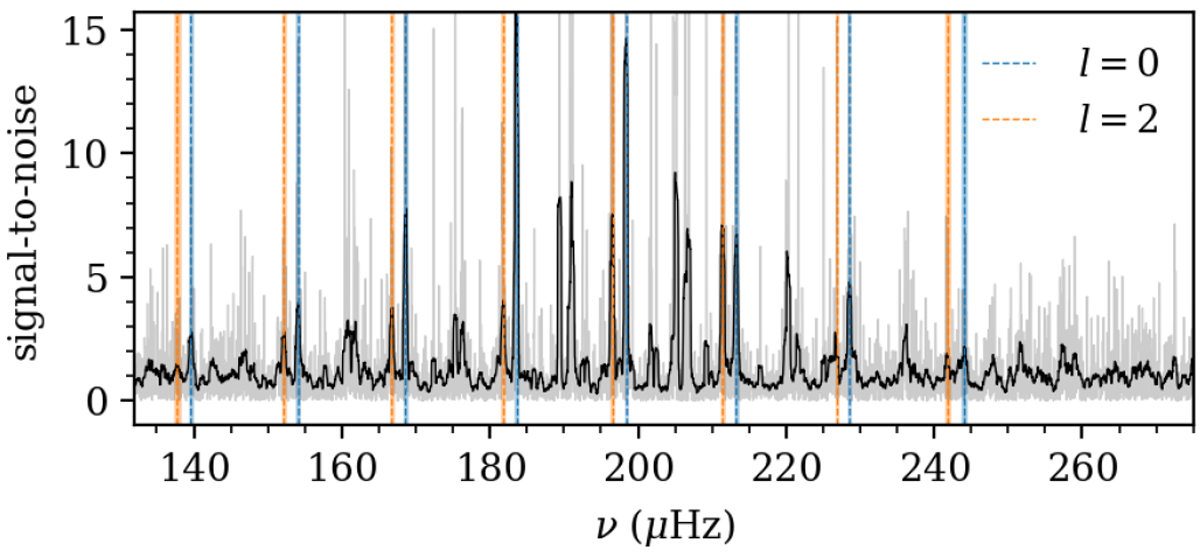
Download original image
Asteroseimic signal-to-noise ratio power spectrum for HD 29399 (TIC 38828538) in light grey and the smoothed spectrum in black. The locations of the radial, l = 0, and quadrupolar, l = 2, oscillation modes are shown with dashed lines, and their 68% credible regions are shaded in blue and orange, respectively.
Current usage metrics show cumulative count of Article Views (full-text article views including HTML views, PDF and ePub downloads, according to the available data) and Abstracts Views on Vision4Press platform.
Data correspond to usage on the plateform after 2015. The current usage metrics is available 48-96 hours after online publication and is updated daily on week days.
Initial download of the metrics may take a while.