Fig. 3
Download original image
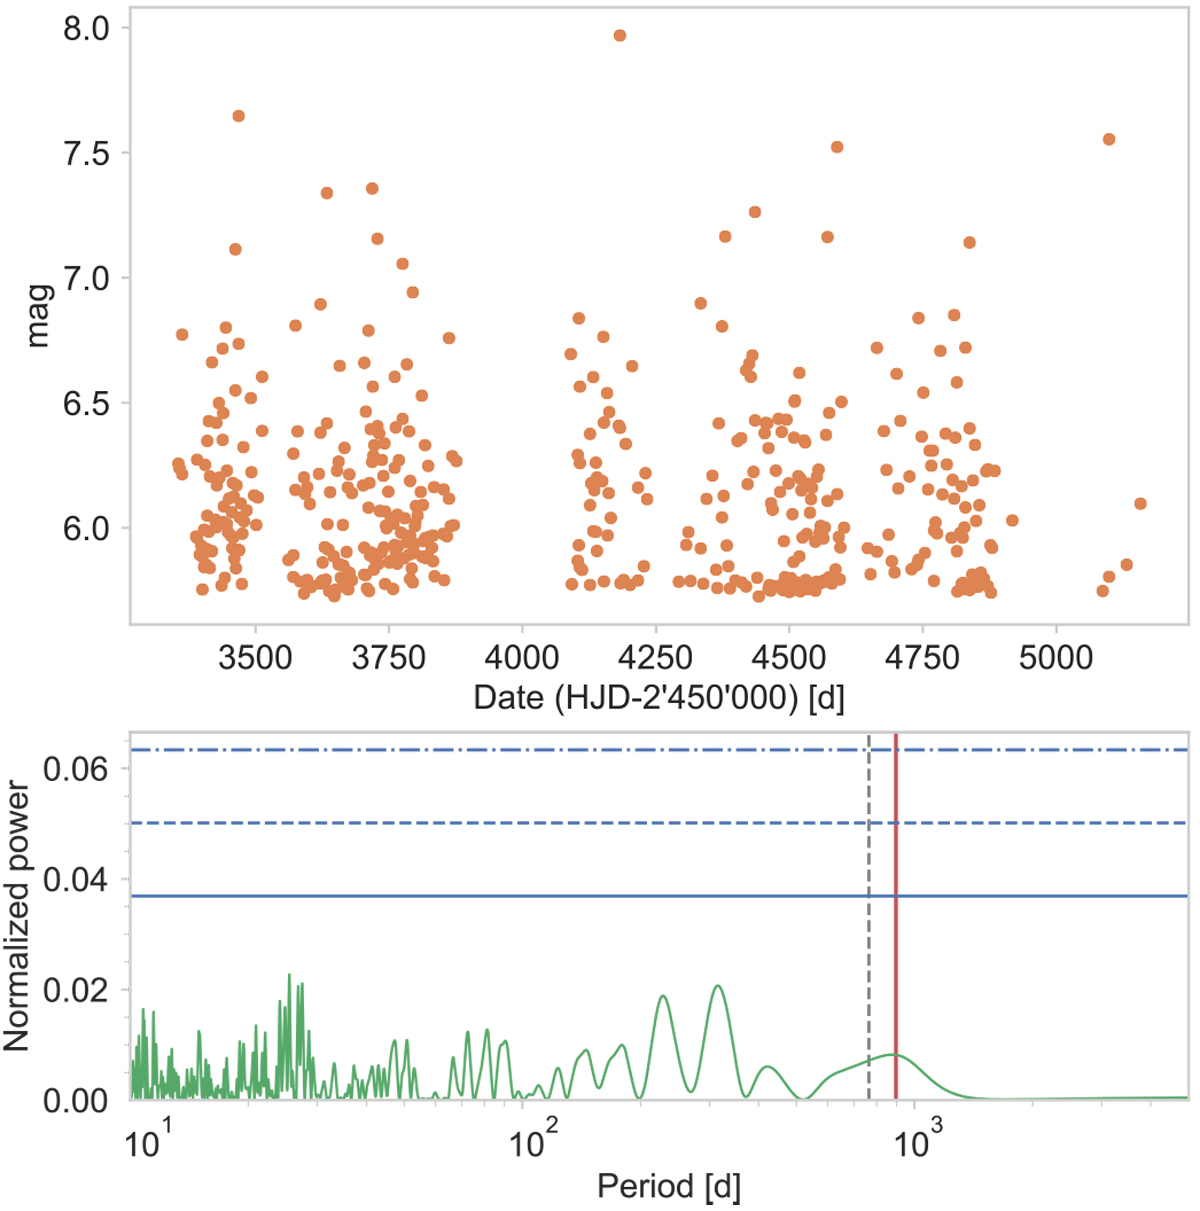
Light curve (top) and periodogram (bottom) of HD 29399 from the ASAS-3 data (Pojmański (2002)). Top: Data acquired after 3300 [HJD-2 450 000], the ASAS-3300 dataset (see text). Bottom: Periodogram of the ASAS-3300 dataset. The red vertical line corresponds to the 897.2-day period found in the radial velocities, and the dashed-vertical line to the 765-day period found by Wittenmyer et al. (2017). Horizontal lines, from bottom to top, are the FAP levels at 10%, 1%, and 0.1% respectively.
Current usage metrics show cumulative count of Article Views (full-text article views including HTML views, PDF and ePub downloads, according to the available data) and Abstracts Views on Vision4Press platform.
Data correspond to usage on the plateform after 2015. The current usage metrics is available 48-96 hours after online publication and is updated daily on week days.
Initial download of the metrics may take a while.