Fig. 10
Download original image
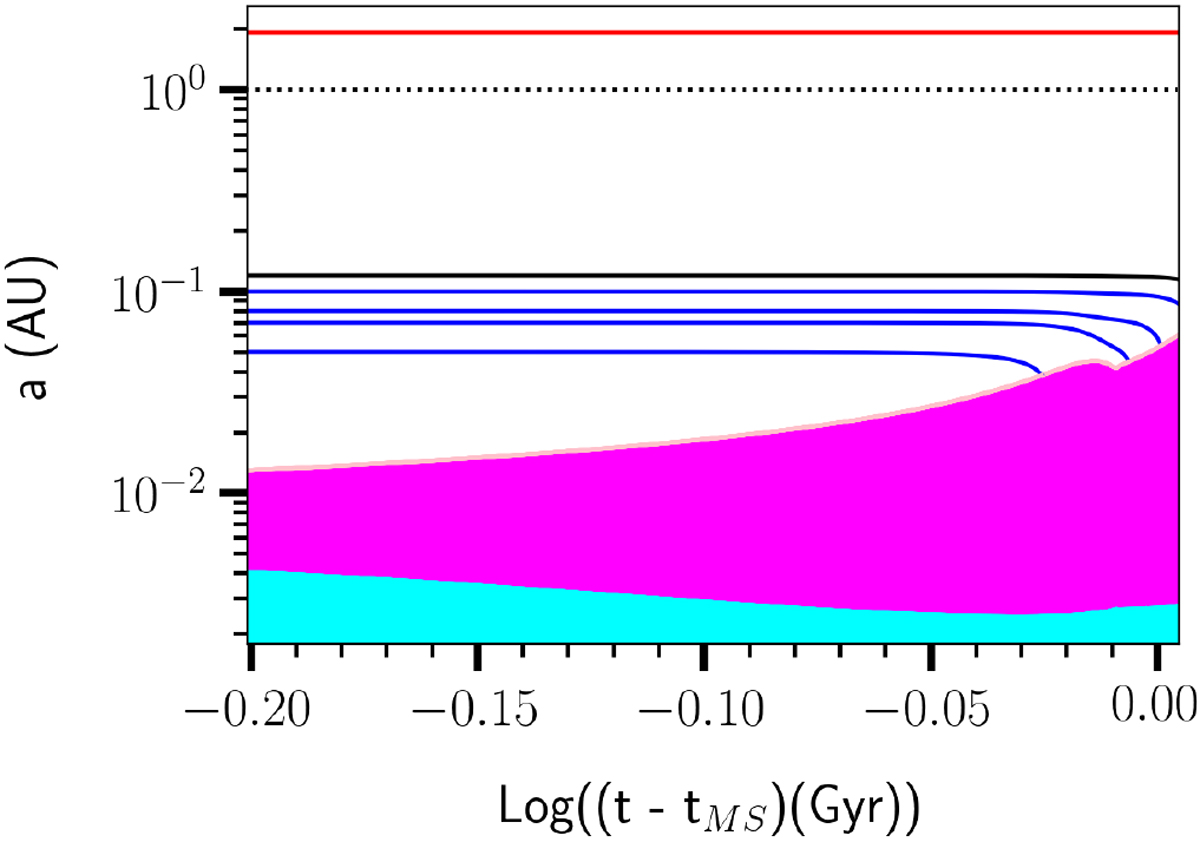
Evolution of the orbital distance after the MS (to the RGB branch). The solid red line represents the orbit of the planet. The solid black line shows the value for the orbital distance below which the planet will be engulfed. The magenta area represents the stellar convective envelope, while the cyan area shows the extension of the radiative interior.
Current usage metrics show cumulative count of Article Views (full-text article views including HTML views, PDF and ePub downloads, according to the available data) and Abstracts Views on Vision4Press platform.
Data correspond to usage on the plateform after 2015. The current usage metrics is available 48-96 hours after online publication and is updated daily on week days.
Initial download of the metrics may take a while.