Fig. 1
Download original image
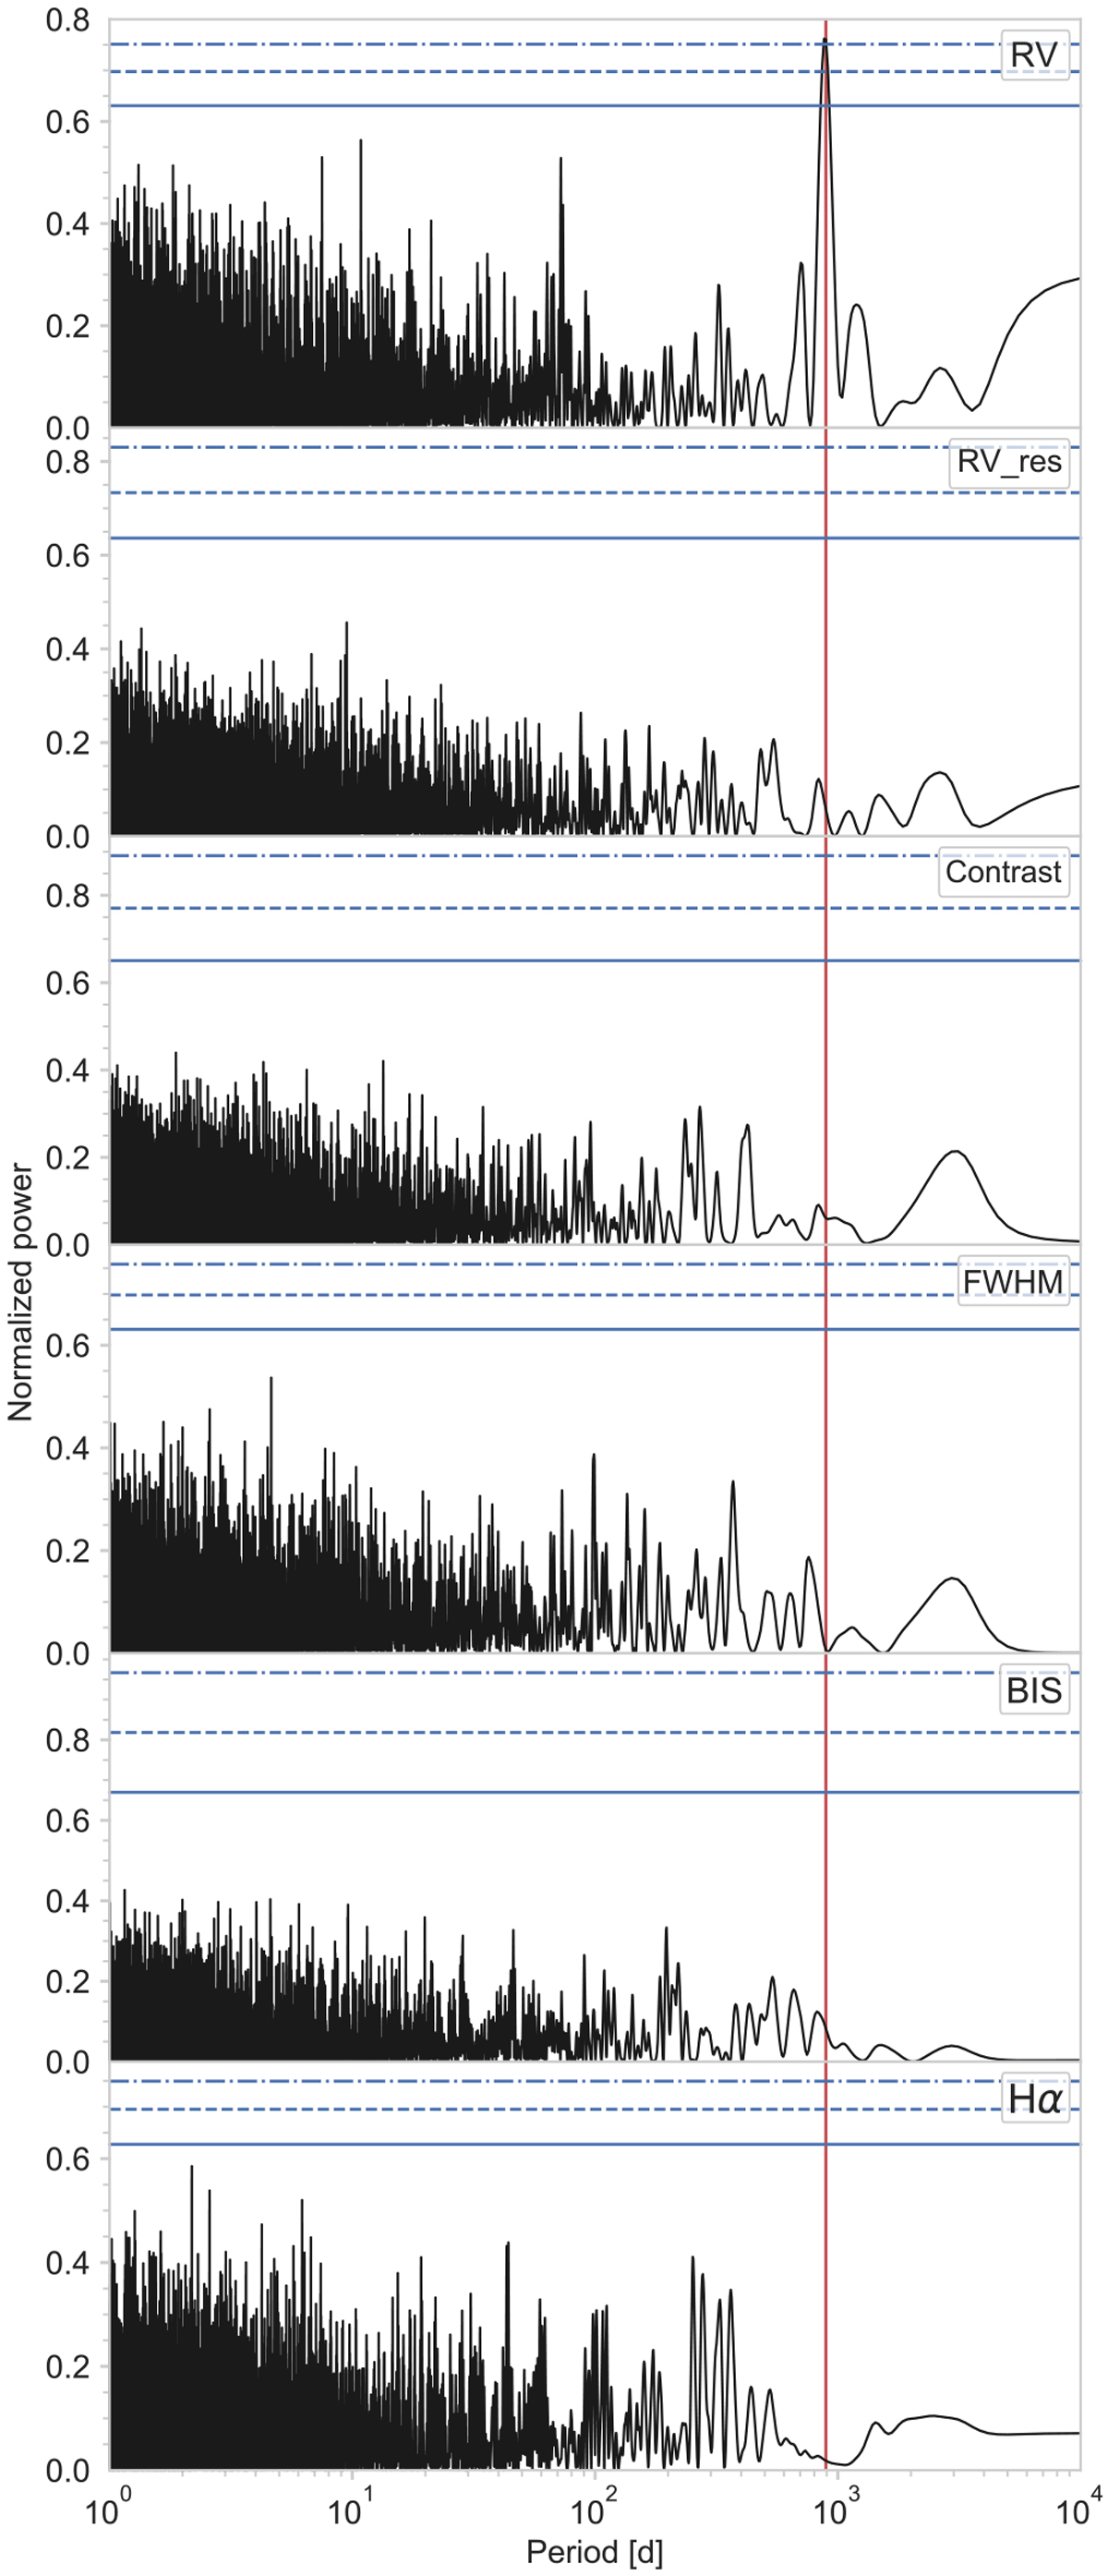
Periodogram of the radial-velocity data (first panel), of the residuals of the radial velocities after subtraction of the fitted periodic signal (second panel), of the contrast (third panel), of the FWHM (fourth panel), of the bisector inverse span (fifth panel), and of the equivalent width of Hα activity (sixth panel). The red vertical line represents the fitted period in the radial-velocity at 892.7 days. Horizontal lines, from bottom to top, are the FAP levels at 10%, 1%, and 0.1% respectively.
Current usage metrics show cumulative count of Article Views (full-text article views including HTML views, PDF and ePub downloads, according to the available data) and Abstracts Views on Vision4Press platform.
Data correspond to usage on the plateform after 2015. The current usage metrics is available 48-96 hours after online publication and is updated daily on week days.
Initial download of the metrics may take a while.