Fig. B.1
Download original image
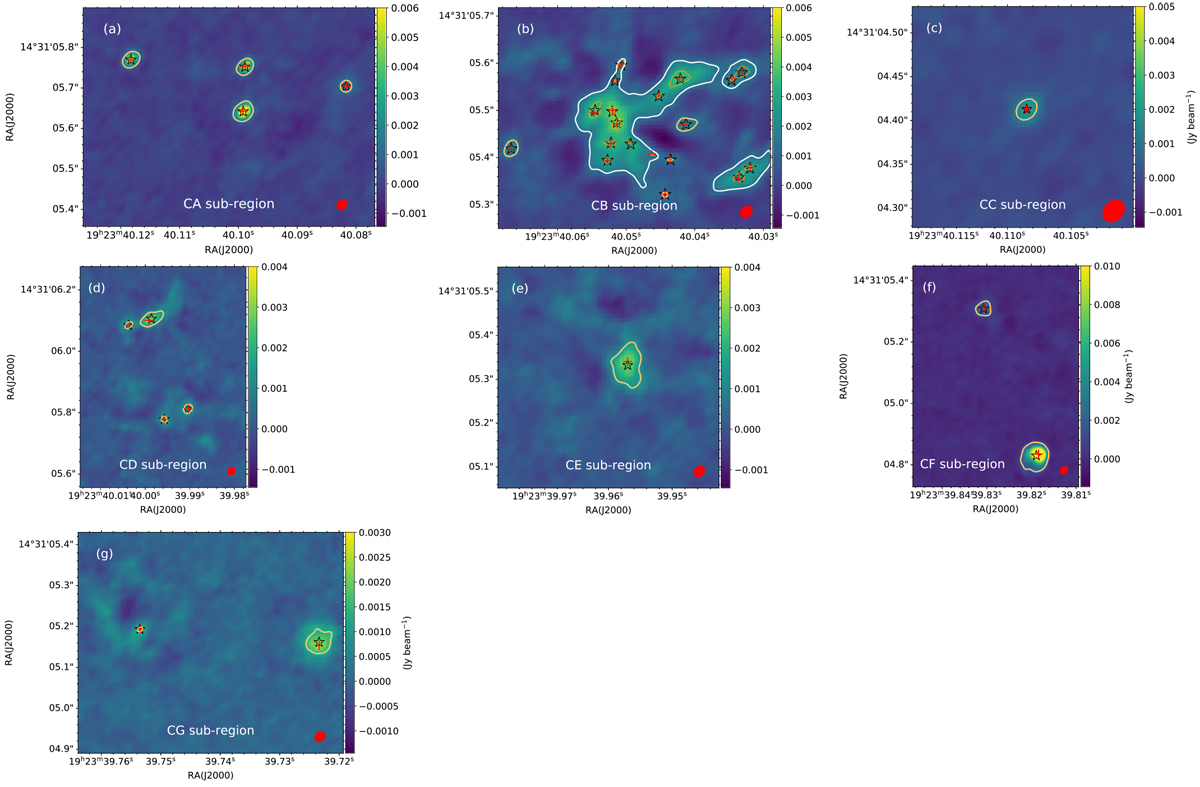
Panels (a) to (g) correspond to subregions CA to CG as in Fig 2. The continuum objects identified in this work (Section 3.2) are marked with red crosses, and the continuum objects identified by the dendrogram algorithm are marked with black stars in each panel. The color scale is the 1.3 mm uv-range constrained image, and the white contour corresponds to the 12σ (1.32 mJy beam−1) identification threshold. The beam size is shown in the bottom right corner of each panel. A total of 32 continuum objects have been identified by the dendrogram algorithm in the surveyed region. The first closed contour above the threshold that separates each identified source is marked as an orange contour to illustrate the “closed contour” identification method described in Section 3.2.
Current usage metrics show cumulative count of Article Views (full-text article views including HTML views, PDF and ePub downloads, according to the available data) and Abstracts Views on Vision4Press platform.
Data correspond to usage on the plateform after 2015. The current usage metrics is available 48-96 hours after online publication and is updated daily on week days.
Initial download of the metrics may take a while.