Free Access
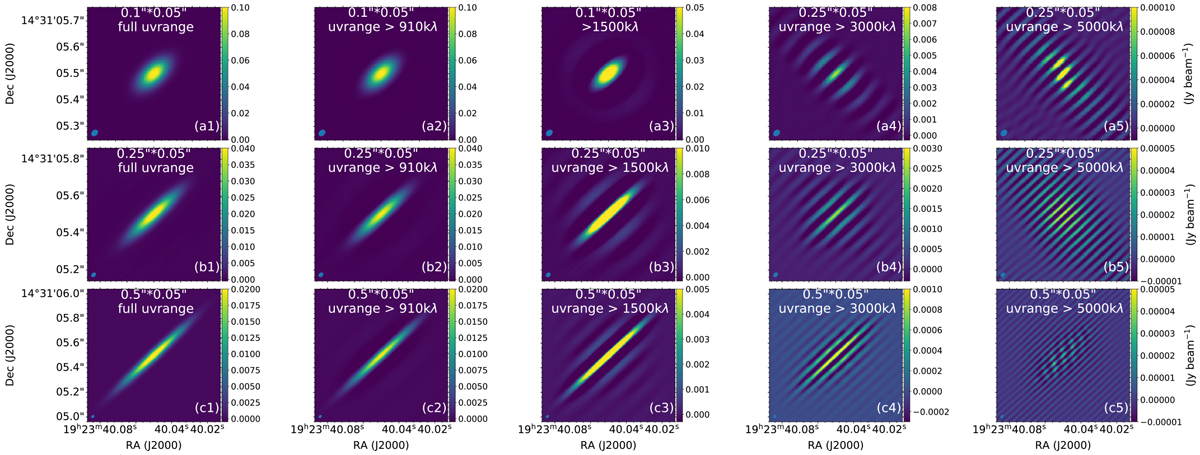
Fig. A.2
Download original image
Simulated continuum images with different source sizes and uv ranges. No simulated sources have embedded point sources. The source sizes and uv-range cutoff thresholds are labeled in each panel. The beam size is shown in the bottom left corner of each panel.
Current usage metrics show cumulative count of Article Views (full-text article views including HTML views, PDF and ePub downloads, according to the available data) and Abstracts Views on Vision4Press platform.
Data correspond to usage on the plateform after 2015. The current usage metrics is available 48-96 hours after online publication and is updated daily on week days.
Initial download of the metrics may take a while.