Fig. A.1
Download original image
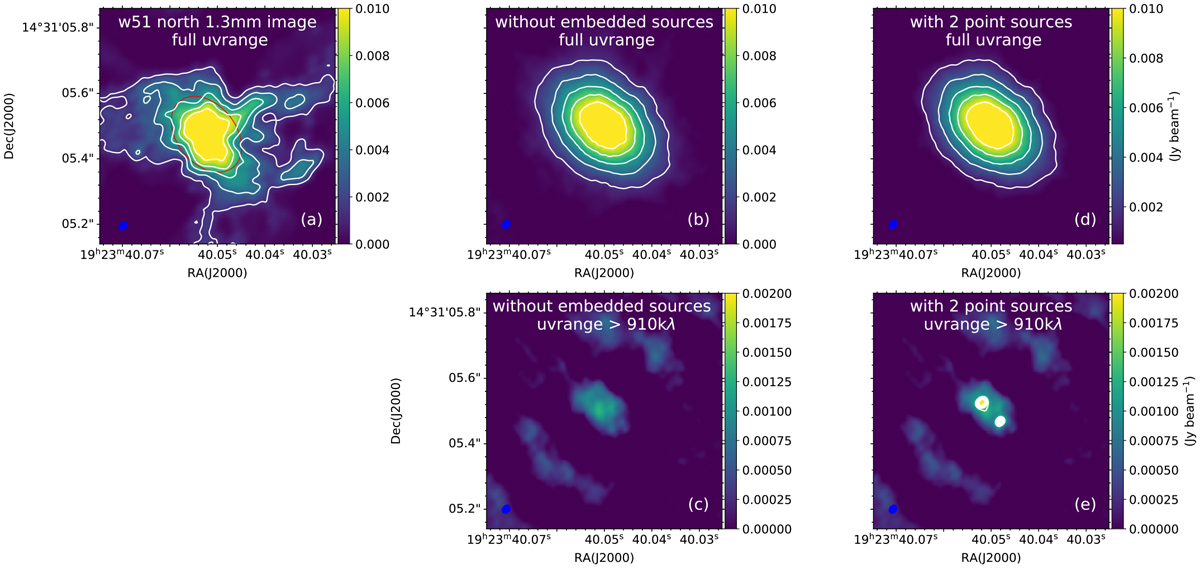
Panel (a): 1.3 mm continuum image of the W51 North region with a full uv range. The red ellipse is given by Gaussian fitting toward W51 North. This ellipse has been adopted as a model to perform ALMA simulations. Panel (b): Simulated full uv-range continuum image without any embedded source. Panel (c): Simulated uv-range constrained (> 910 kλ) continuum image without any embedded sources. Panel (d): Simulated full uv-range continuum image with two point sources. Panel (e): Simulated uv-range constrained (> 910 kλ) continuum image with two point sources. The contour levels in all the panels start from 12σ (1.32 mJy beam−1). The residual map of the 1.3 mm continuum image generated by the TCLEAN task of CASA has been added to the simulated images to realistically simulate the noise.
Current usage metrics show cumulative count of Article Views (full-text article views including HTML views, PDF and ePub downloads, according to the available data) and Abstracts Views on Vision4Press platform.
Data correspond to usage on the plateform after 2015. The current usage metrics is available 48-96 hours after online publication and is updated daily on week days.
Initial download of the metrics may take a while.