Fig. 5
Download original image
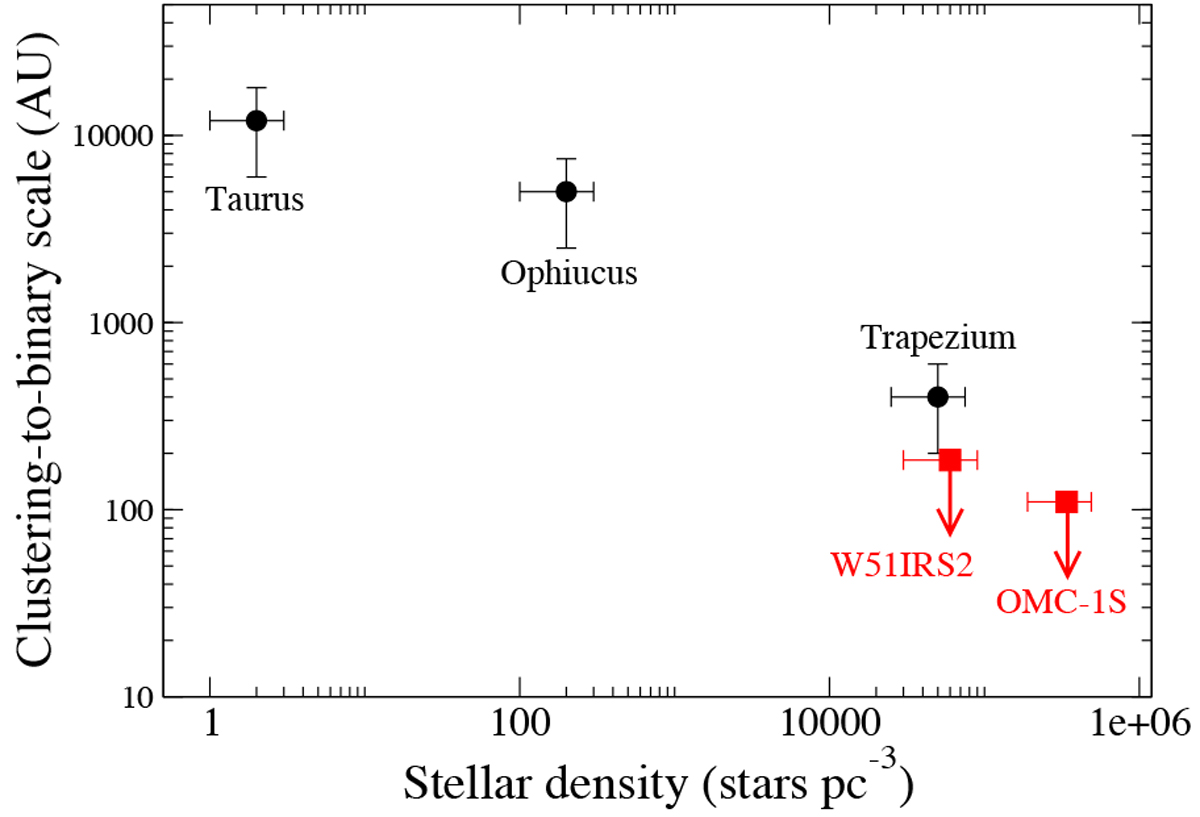
Anticorrelation between the clustering-to-binary scale in the MSDC plot and stellar density for different clouds. The data point of W51 IRS2 is taken from this work; the data point of OMC-1S is taken from Palau et al. (2018); and the data points of Taurus, Ophiucus, and Trapezium are taken from Gómez et al. (1993) and Simon (1997).
Current usage metrics show cumulative count of Article Views (full-text article views including HTML views, PDF and ePub downloads, according to the available data) and Abstracts Views on Vision4Press platform.
Data correspond to usage on the plateform after 2015. The current usage metrics is available 48-96 hours after online publication and is updated daily on week days.
Initial download of the metrics may take a while.