Fig. 4
Download original image
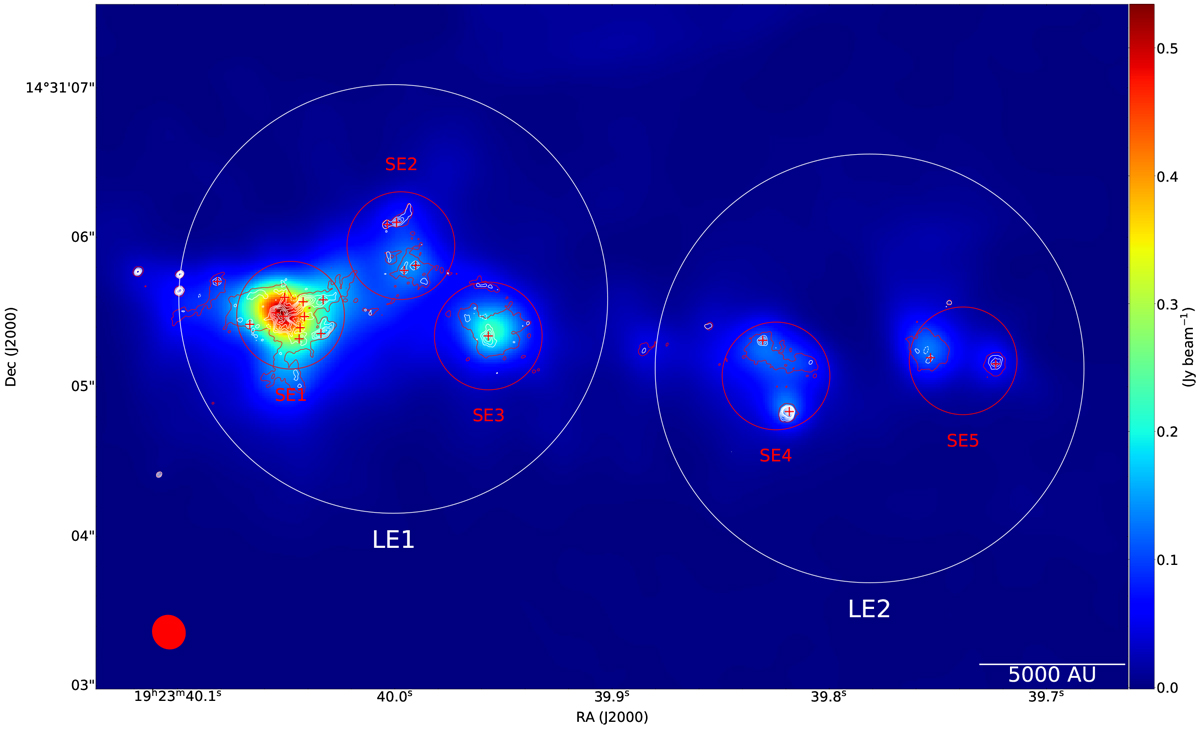
Color image: 1.3 mm low-resolution continuum image with the uv range 9–910 kλ, white contours indicate the 1.3 mm continuum with a uv range larger than 910 kλ. The white contour levels are [−12, −6, 6, 12, 12, 18, 24, 30, 36, 40, 60, 80, 100, 120,140,160] × σ (σ = 0.11 mJy beam−1), and the beam size is shown in the bottom left corner. The red contour in the plot isthe 1.3 mm continuum with a full uv range, and the contour level is 6σ (σ = 0.15 mJ beam−1). The small and larger circles denote the “small-scale ensembles” (SEs) and “large-scale ensembles” (LEs), respectively. These SEs and LEs are defined by the spatial scales corresponding to the first and second breaks from the MSDC analysis (see Sect. 4.2 for details). Overall, five SEs and two LEs are defined in the region, and their names are labeled in the figure. The information about these ensembles is listed in Table 2.
Current usage metrics show cumulative count of Article Views (full-text article views including HTML views, PDF and ePub downloads, according to the available data) and Abstracts Views on Vision4Press platform.
Data correspond to usage on the plateform after 2015. The current usage metrics is available 48-96 hours after online publication and is updated daily on week days.
Initial download of the metrics may take a while.