Fig. 3
Download original image
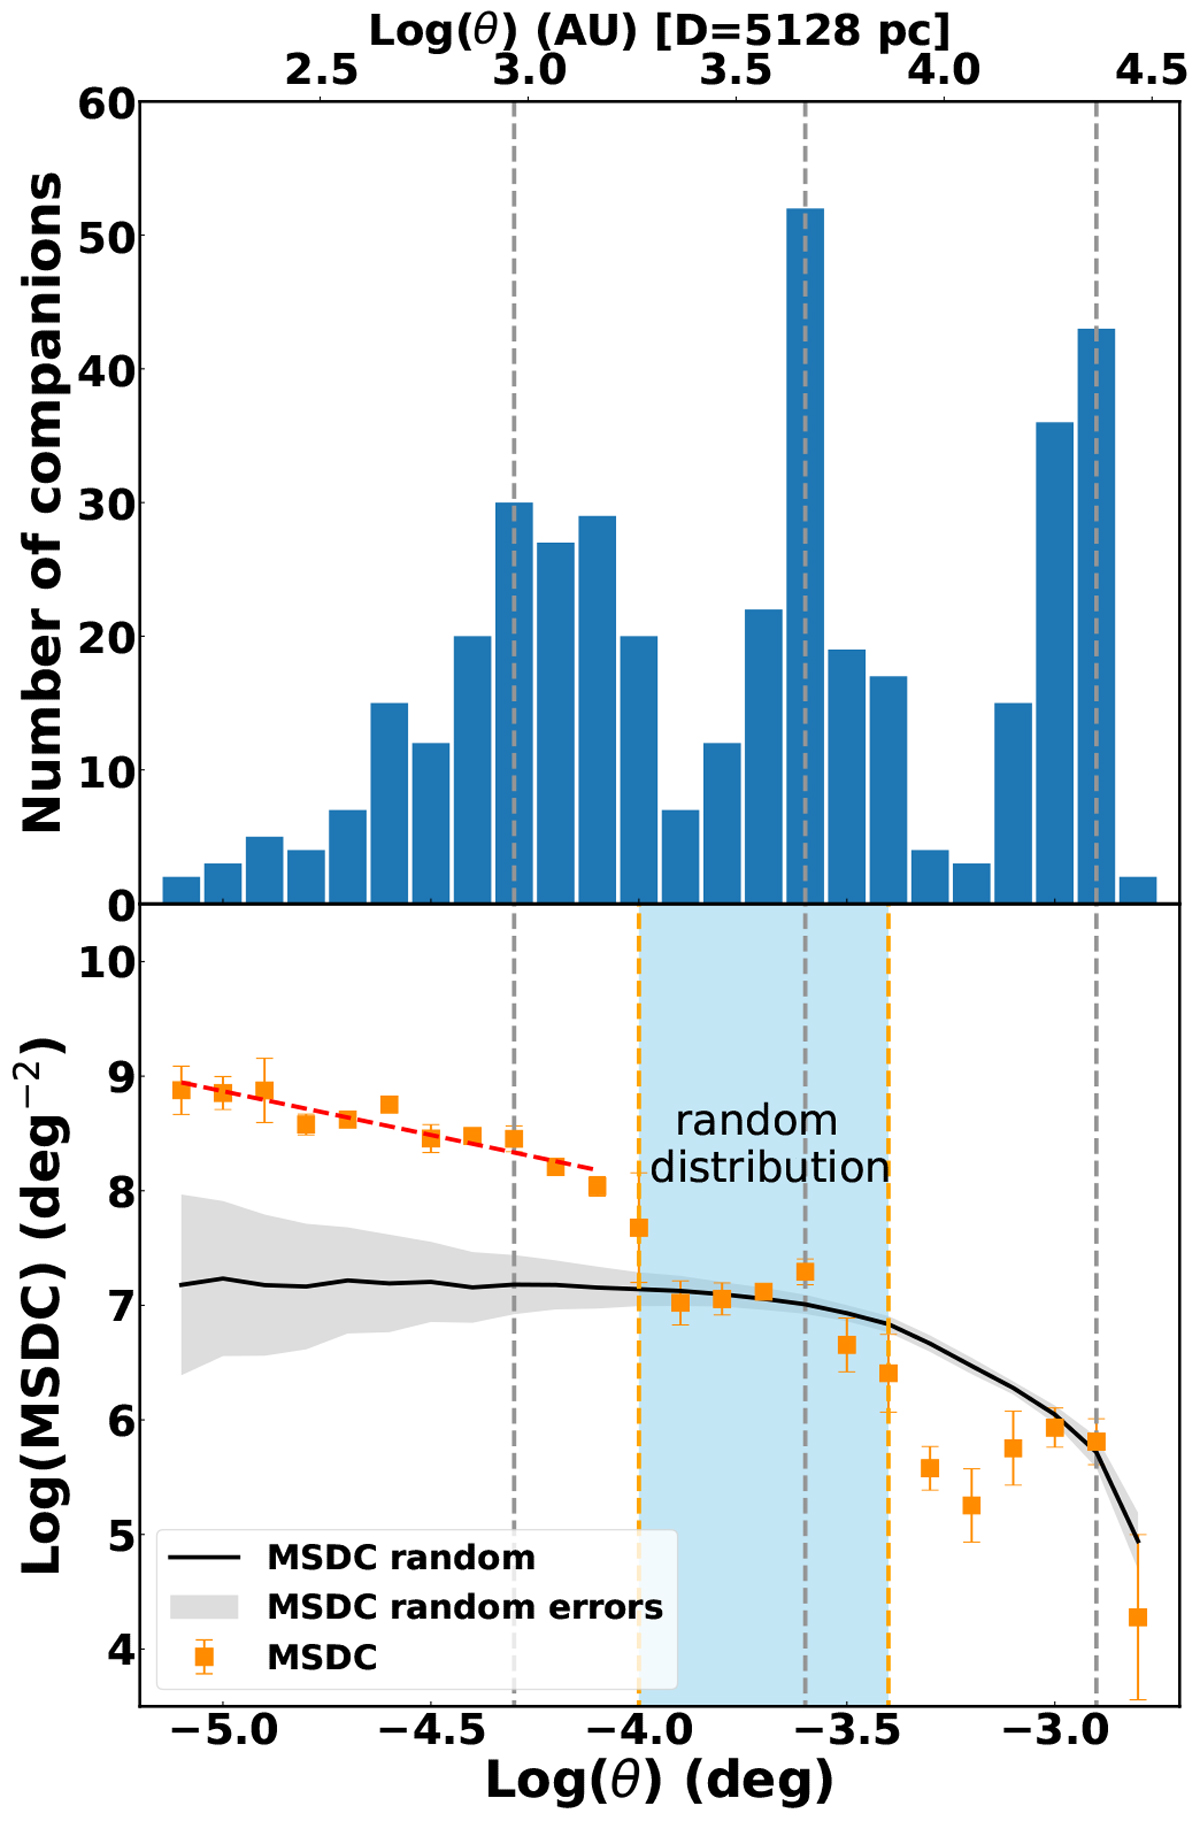
Upper panel: histogram of angular separations of companions. The Y-axis is the number of companions, and the X-axis is angular separations. The gray vertical dashed lines represent the peak number of the companions. Bottom panel: orange squares with error bars represent the mean surface density of companions (MSDC) versus the angular separation of the identified fragments. The orange vertical dashed lines denote the breaks of the MSDC. The black solid line and the gray region represent MSDC and errors that were derived from the 1000 rounds of uniformly, and randomly distributed 29 fragments in the same region. The linear fitting toward the data points at separations smaller than the first break, marked as a red dashed line in the bottom panel, results in a slope of –0.8(±0.1).
Current usage metrics show cumulative count of Article Views (full-text article views including HTML views, PDF and ePub downloads, according to the available data) and Abstracts Views on Vision4Press platform.
Data correspond to usage on the plateform after 2015. The current usage metrics is available 48-96 hours after online publication and is updated daily on week days.
Initial download of the metrics may take a while.