Fig. 2
Download original image
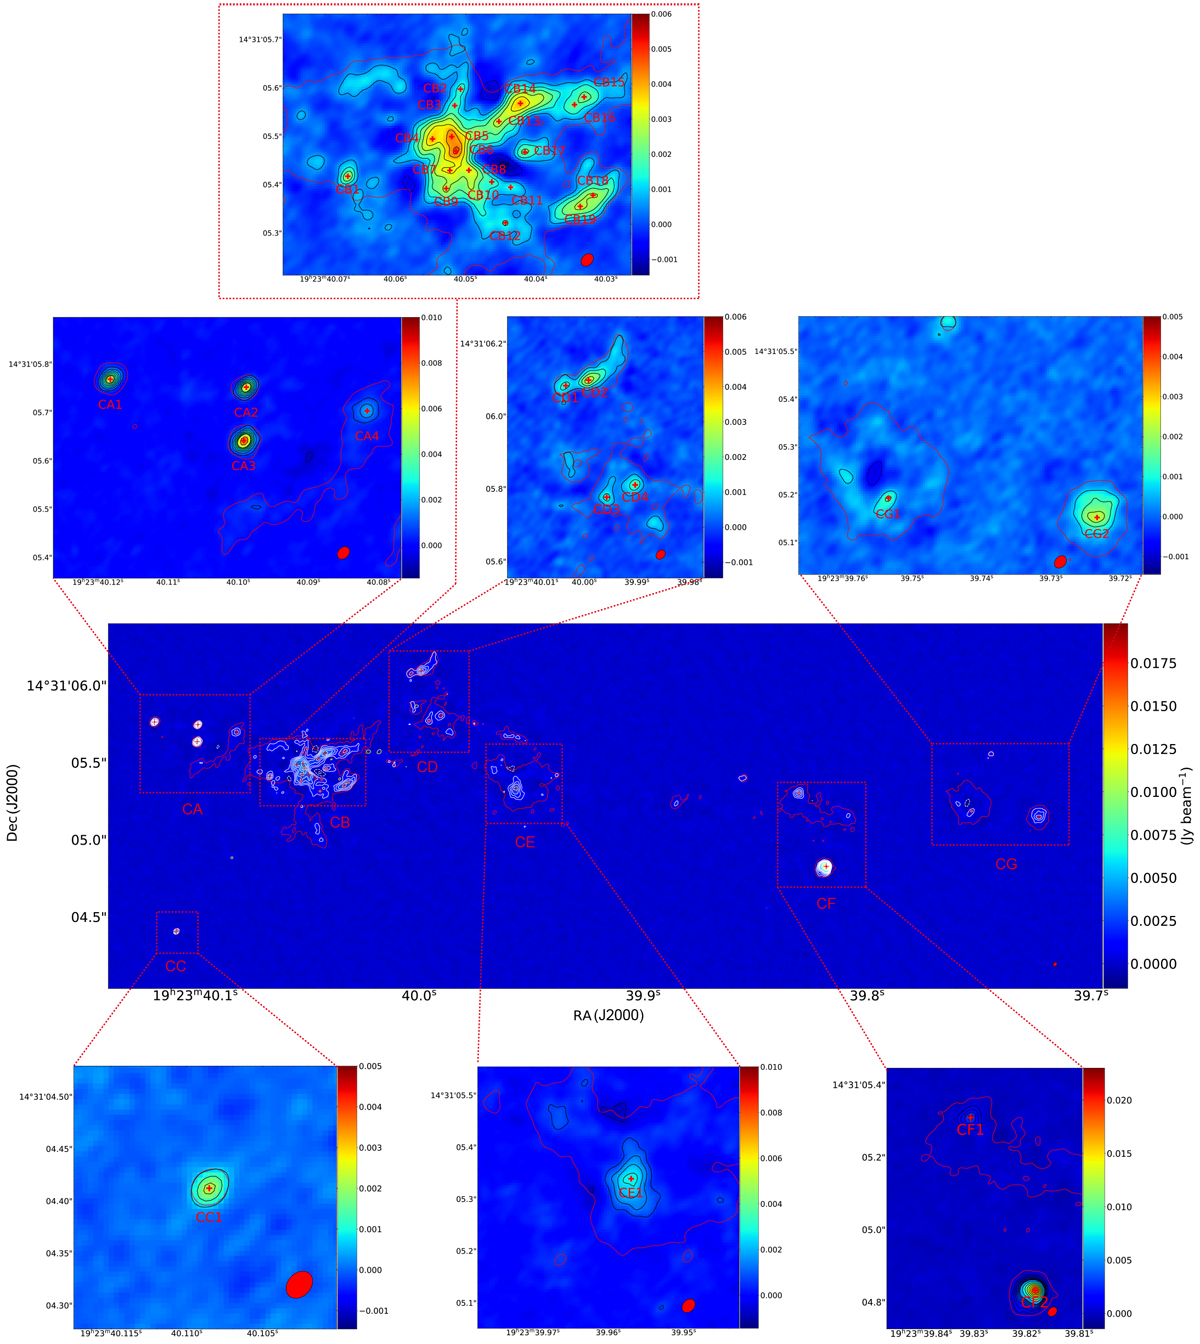
Color image and white contours correspond to the uv-range constrained 1.3 mm high-resolution continuum (with a uv range larger than 910 kλ). The white contour levels are [−12, −6, 6, 12, 18, 24, 30, 36, 40, 60, 80, 100, 120, 140, 160] × σ (σ = 0.11 mJy beam−1), and the beam size is shown in the bottom-right corner of each plot. The red contour in each plot is the full uv-range 1.3 mm high-resolution continuum image, and the contour level is 6σ (σ = 0.15 mJ beam−1). We identified fragments as sources with at least one closed contour above the 12σ (1.32 mJy beam−1) identification threshold. A total of 33 continuum objects have been identified in the region. To illustrate the “closed contour” identification method, we plotted the first closed contour above the threshold that separates each identified source as an orange contour in Fig. B.1. To give a better view of the fragments, we divided the whole region into seven subclumps (clump A to G are named CA, CB, CC, CD, CE, CF, and CG), shown in the individual close-in panels, where contours are shown in black to improve the contrast over the background. The crosses in the subplots indicate the central positions of the identified fragments. The names of the fragments are labeled. A Gaussian fitting was performed to obtain the basic parameters of the identified objects and the fitting results are listed in Table 1.
Current usage metrics show cumulative count of Article Views (full-text article views including HTML views, PDF and ePub downloads, according to the available data) and Abstracts Views on Vision4Press platform.
Data correspond to usage on the plateform after 2015. The current usage metrics is available 48-96 hours after online publication and is updated daily on week days.
Initial download of the metrics may take a while.