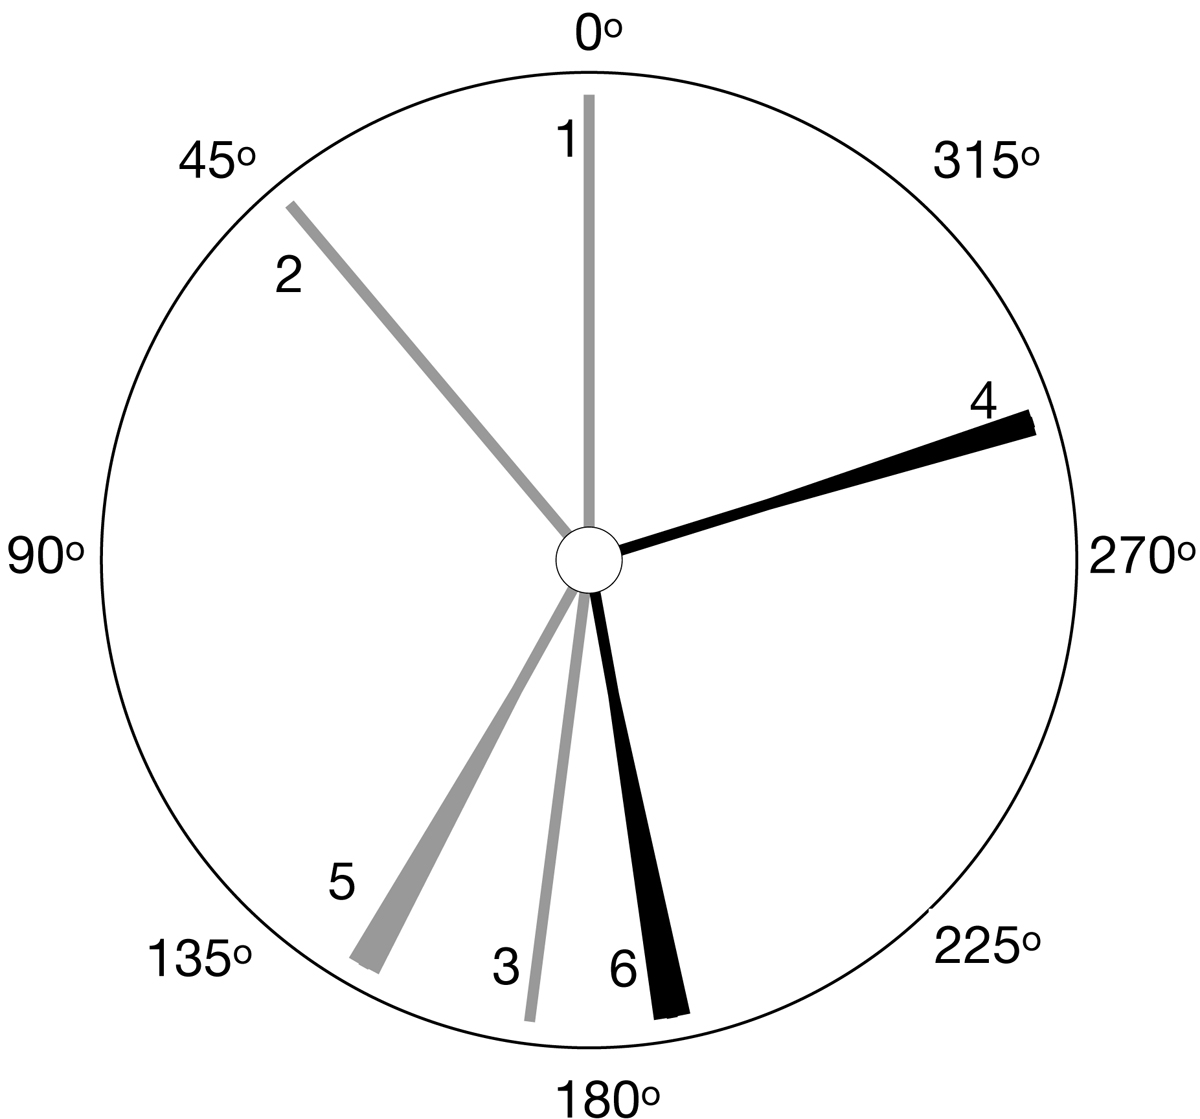
Fig. B.1.
Download original image
Rotational phase plot for each observation. Like a dial in a meter, each line represents the rotational phase of the asteroid at the time of each observation (see Table 1 for the epoch of the observations). The grey dials correspond to observations in the NIR, while black ones to observations in the VIS. The width of the bars is related to the accuracy of the knowledge of the phase due to the propagation of the uncertainty in the rotational period. The phase is arbitrarily set to zero at the epoch of the first observation.
Current usage metrics show cumulative count of Article Views (full-text article views including HTML views, PDF and ePub downloads, according to the available data) and Abstracts Views on Vision4Press platform.
Data correspond to usage on the plateform after 2015. The current usage metrics is available 48-96 hours after online publication and is updated daily on week days.
Initial download of the metrics may take a while.