Fig. 7.
Download original image
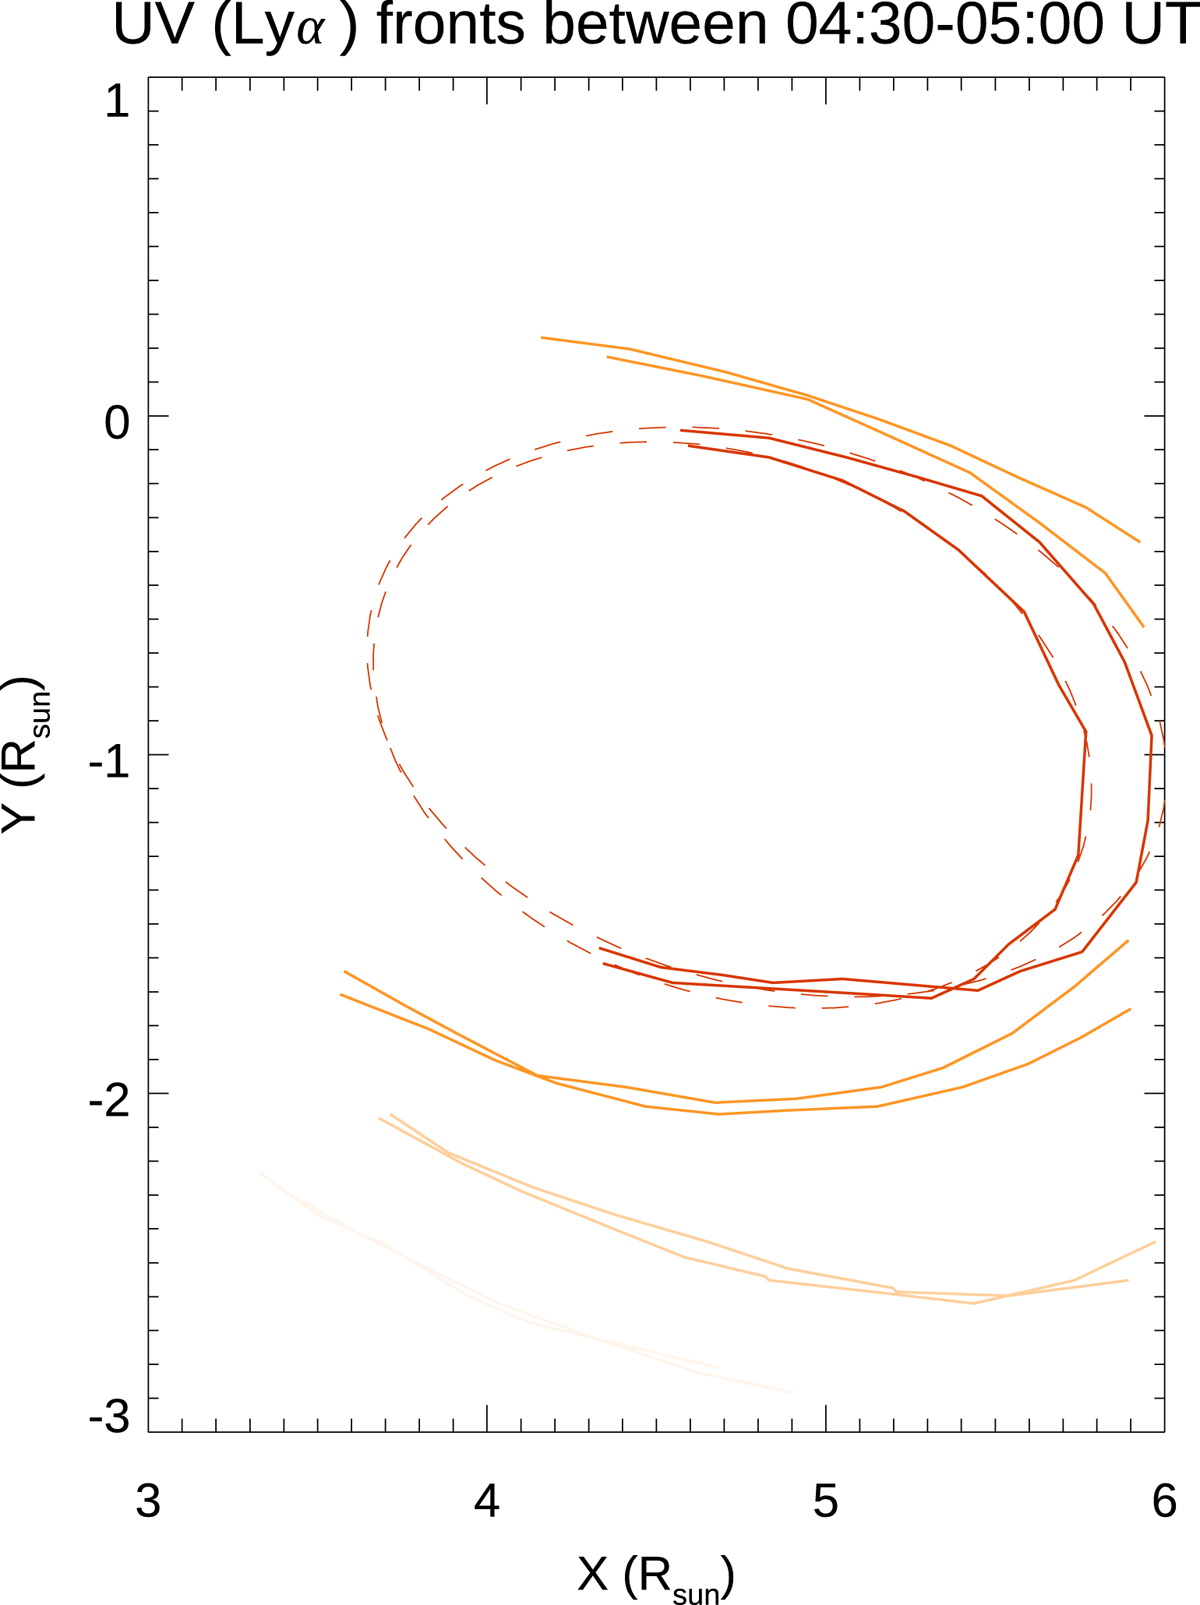
Tracked locations of multiple UV fronts as observed by Metis on 16–17 January 2021 between 04:30 and 05:00 UT. The inner front locations measured at two different times (solid red line) have been fitted with an ellipse (dashed red line) to measure the CME centre and front speeds (see text). The orange and yellow lines identify the locations of two other fronts visible in the images.
Current usage metrics show cumulative count of Article Views (full-text article views including HTML views, PDF and ePub downloads, according to the available data) and Abstracts Views on Vision4Press platform.
Data correspond to usage on the plateform after 2015. The current usage metrics is available 48-96 hours after online publication and is updated daily on week days.
Initial download of the metrics may take a while.