Fig. 6.
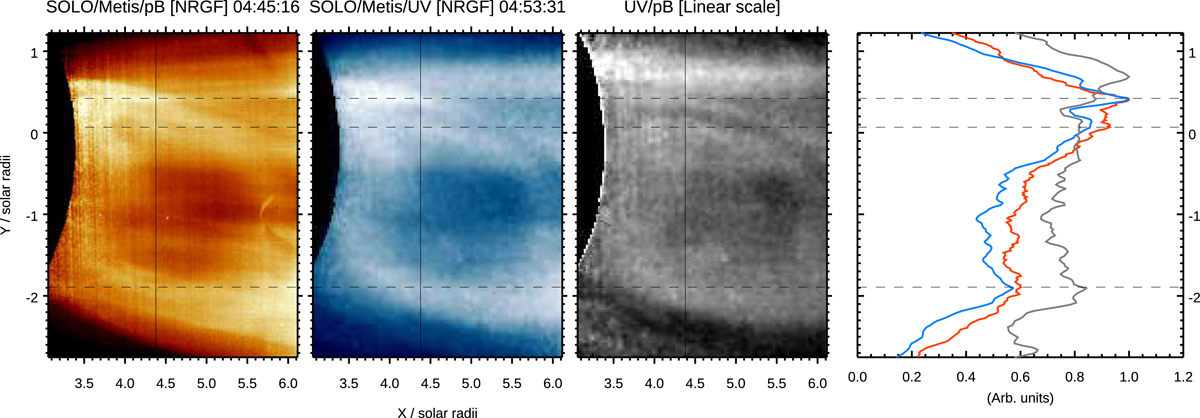
Download original image
First three panels: same images shown in the second column of Fig. 5. Right-most panel: count rate profiles along a N–S cut in both Metis channels. The blue and red profiles, each normalised to their peak value, refer to the Ly-α and pB images, respectively. The grey profile shows the ratio of the two channels along the same cut. The horizontal dashed lines represent fiducials added to aid the identification of features seen in images with those seen in the count rate profiles.
Current usage metrics show cumulative count of Article Views (full-text article views including HTML views, PDF and ePub downloads, according to the available data) and Abstracts Views on Vision4Press platform.
Data correspond to usage on the plateform after 2015. The current usage metrics is available 48-96 hours after online publication and is updated daily on week days.
Initial download of the metrics may take a while.