Fig. 5.
Download original image
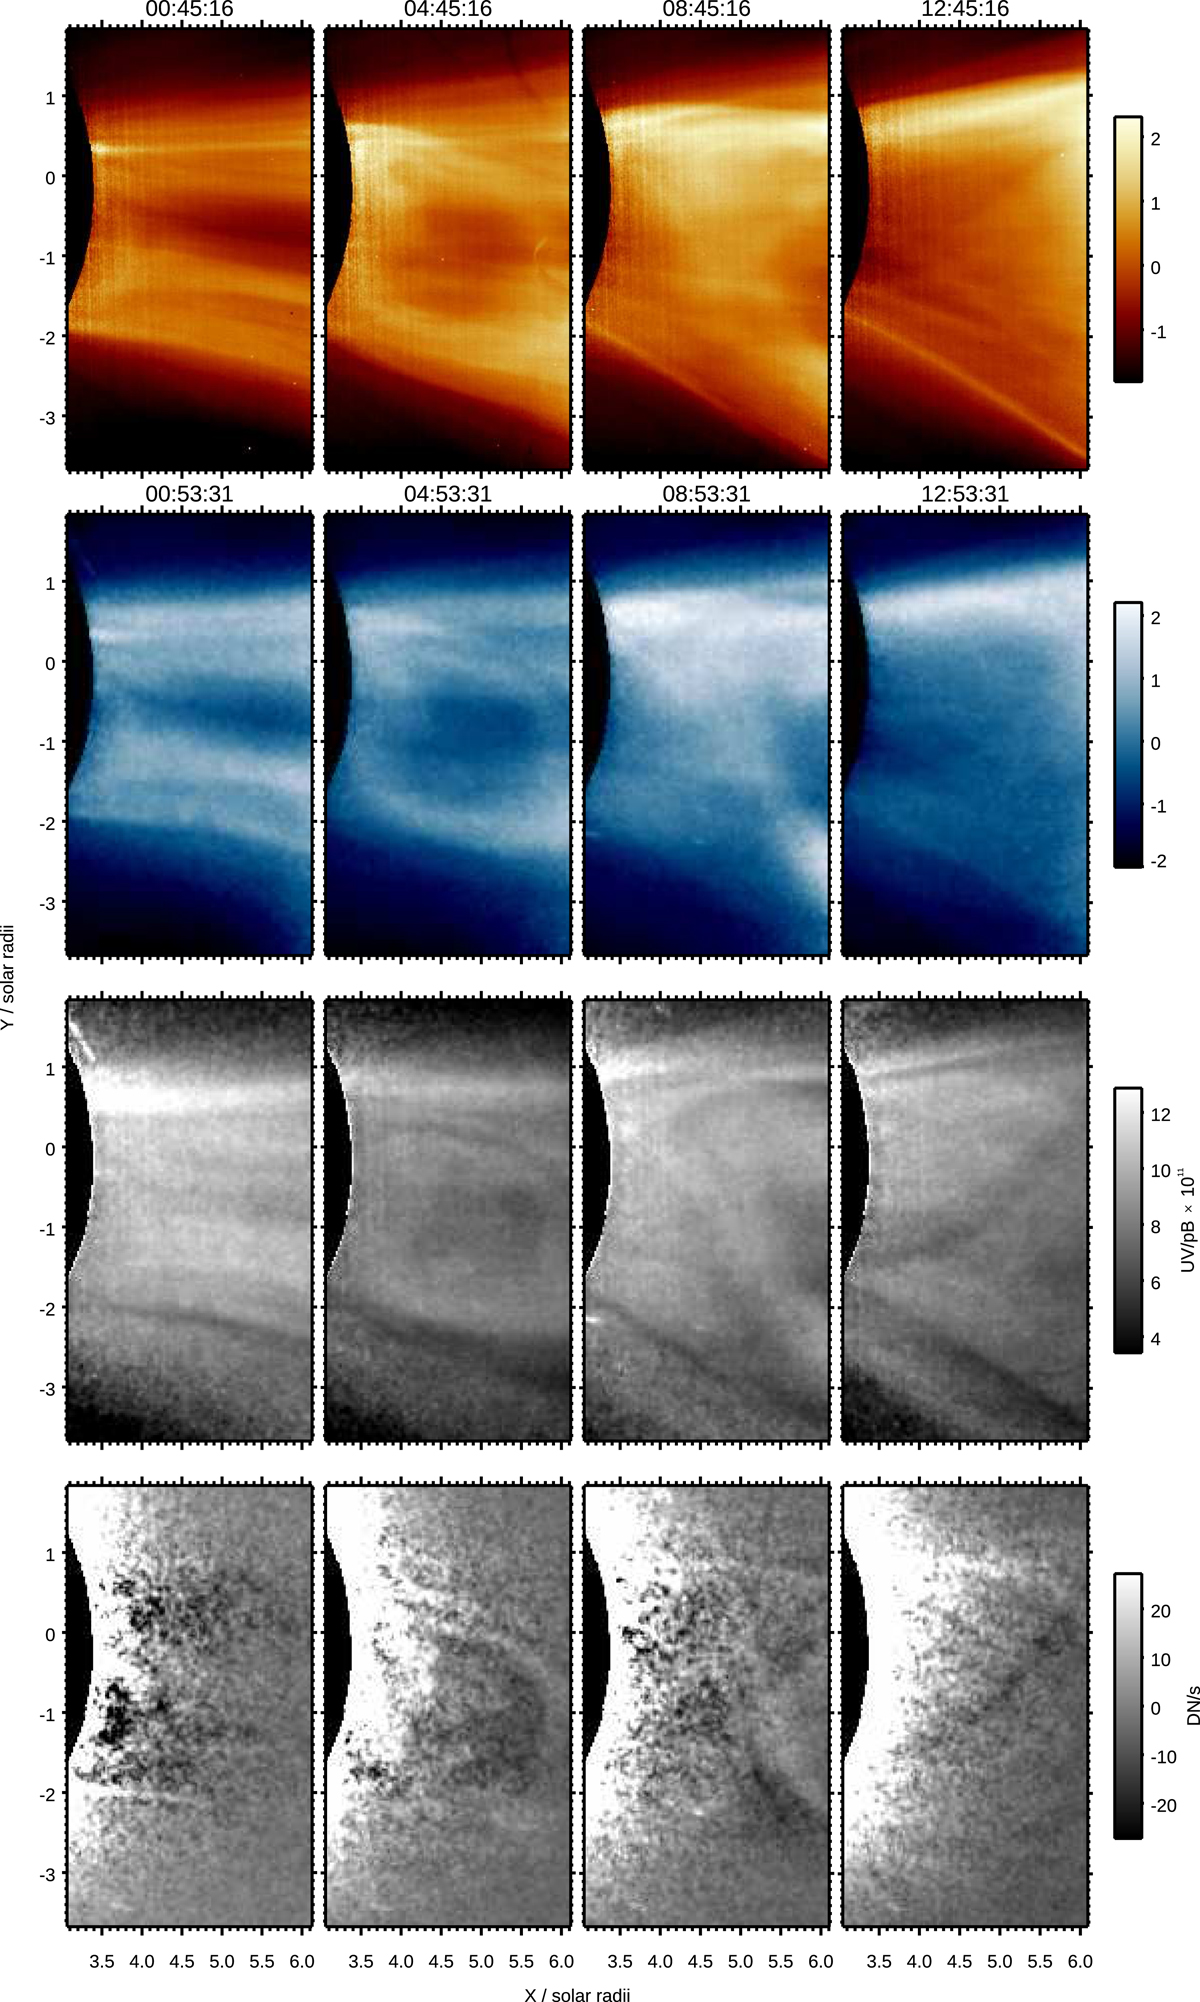
Development of the 16–17 January 2021 CME as observed by the Solar Orbiter/Metis coronagraph. First and second row from the top: VL pB and UV Ly-α images, respectively, processed via the NRGF algorithm (unit-less numbers as produced by the algorithm). The time labelling each image refers to the centre of the acquisition; in particular, the UV image shown in the second row is the second image in each data acquisition set. Third row: ratio of the UV to pB images, and last row: difference images obtained from the two pairs of UV images in each data acquisition session.
Current usage metrics show cumulative count of Article Views (full-text article views including HTML views, PDF and ePub downloads, according to the available data) and Abstracts Views on Vision4Press platform.
Data correspond to usage on the plateform after 2015. The current usage metrics is available 48-96 hours after online publication and is updated daily on week days.
Initial download of the metrics may take a while.