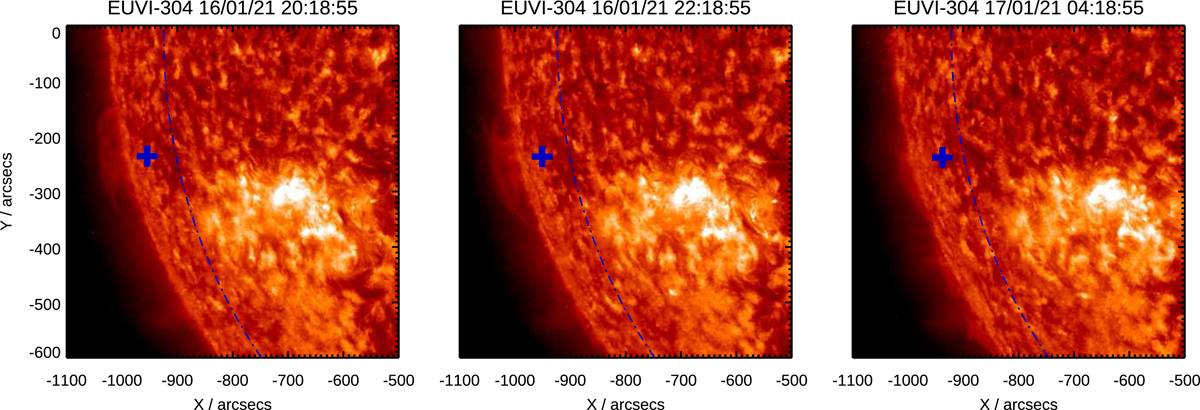
Fig. 3.
Download original image
Area of the likely SR of the 16–17 January 2021 CME as seen by STEREO-A/EUVI in the 30.4 nm band at three times around the estimated start of the event. The dashed line represents the solar limb as seen by Solar Orbiter/EUI/FSI, while the cross marks the position of the intercept on the solar surface of the vertical axis of the flux rope estimated via GCS reconstruction (see also Fig. 2).
Current usage metrics show cumulative count of Article Views (full-text article views including HTML views, PDF and ePub downloads, according to the available data) and Abstracts Views on Vision4Press platform.
Data correspond to usage on the plateform after 2015. The current usage metrics is available 48-96 hours after online publication and is updated daily on week days.
Initial download of the metrics may take a while.