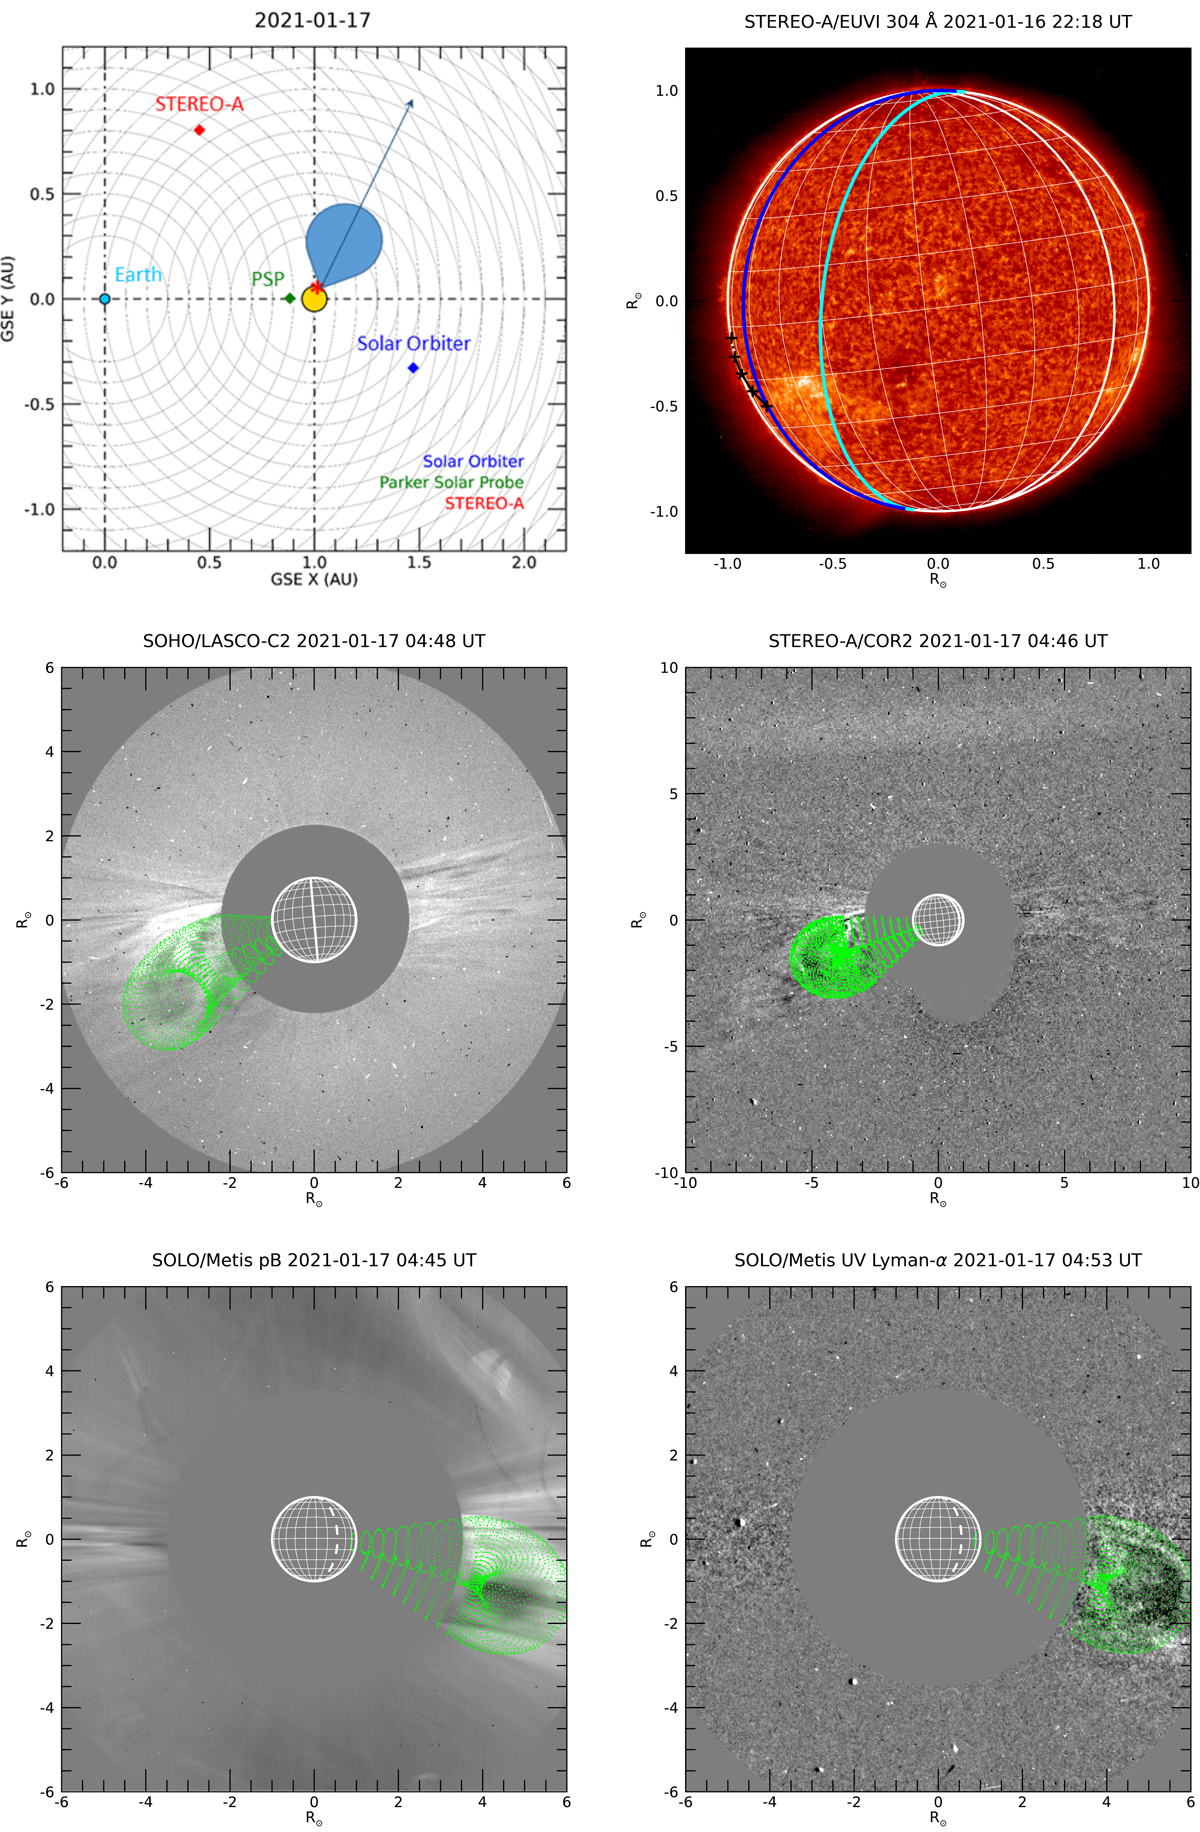
Fig. 2.
Download original image
Top-left panel: location of different spacecraft on 16–17 January 2021 during the CME observed by Metis. The red asterisk on the circle representing the Sun shows the approximate location of the nearby AR (NOAA 12797). The blue arrow indicates the main longitude propagation direction of the CME as determined with GCS fitting. Top-right panel: nearby AR (NOAA 12797) as observed by the STEREO-A/EUVI 30.4 nm image at 22:18 UT. The asterisk marks the intercept on the solar surface of the vertical axis of the flux rope (see also Fig. 3, which shows the region in more detail), while the connected crosses indicate the projection of the longitudinal axis (the last point is beyond the limb and is connected with a dotted segment). The solid blue and cyan lines represent the position of the solar limb as seen from Solar Orbiter and Earth (and SOHO), respectively. Middle row: GCS reconstruction applied to running-difference images by the SOHO/LASCO-C2 (left) and STEREO-A/COR2 (right) instruments. Bottom row: same reconstruction applied to the Solar Orbiter/Metis VL (pB) image (left) and the UV (Ly-α) image (right). The features seen in the NW sector of the Metis/pB image are due to transient spurious reflections occasionally recorded in both channels, possibly due to small debris passing in front of the telescope aperture. In this case, these spurious reflections do not significantly affect the sector of the FOV where the CME is observed. For reference purposes, the Stonyhurst coordinate grid (with 15° spacing) is overlaid on all the images, along with the central meridian as seen from Earth (solid white line) or the meridian opposite to Earth (dashed white line), whichever of the two is visible on the Sun’s disk.
Current usage metrics show cumulative count of Article Views (full-text article views including HTML views, PDF and ePub downloads, according to the available data) and Abstracts Views on Vision4Press platform.
Data correspond to usage on the plateform after 2015. The current usage metrics is available 48-96 hours after online publication and is updated daily on week days.
Initial download of the metrics may take a while.