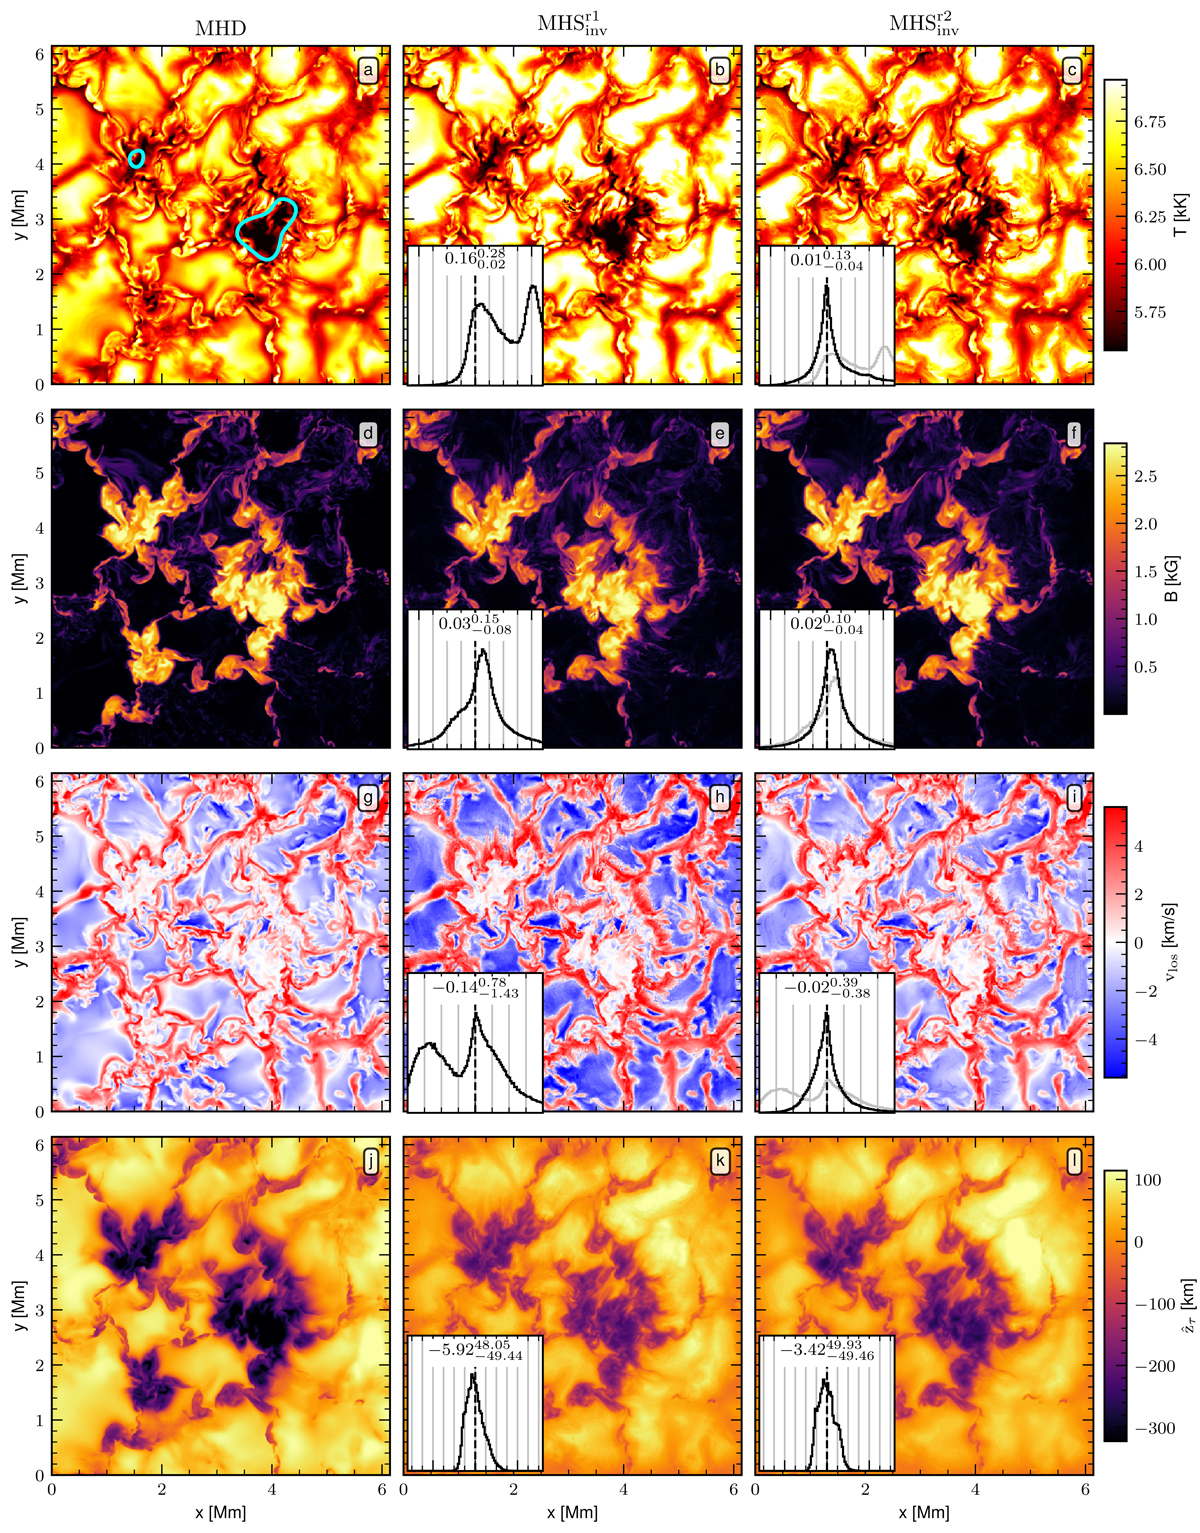
Fig. A.1.
Download original image
Temperature in kK (top row), magnetic field strength in kG (second row), line-of-sight velocity in km/s (third row), and the Wilson effect (as compared to the quiet Sun τ = 1 height) in km (last row) at optical depth τ5nm = 1 for the MHD simulation (left column), the first run of the MHS inversion (Sr1, middle column), and the second run of the MHS inversion (Sr2, right column). All the panels per row share the same color scaling, shown at the right. Sub-panels in panels b-c, e-f, h-i, and k-l show in black the histogram of the difference between the MHD and the MHS inversion of Sr1 (Sr2) in panels b, e, h, and k (in panels c, f, i, and l). For the sake of comparison, panels c, f, i, and l show the same histograms presented in b, e, h, and k in gray. The values in the top part of each histogram are the median value together with percentile 16 as sub-index and percentile 84 as super-index. Vertical gray lines appear every 0.05 kK, 0.05 kG, 0.4 km/s, and 50 km for the temperature, magnetic field strength, line-of-sight velocity, and Wilson effect, respectively, and are centered at 0 (shown with a dark dashed line). The blue contour in panel a represents the normalized continuum intensity threshold of 0.65, highlighting the position of the pores.
Current usage metrics show cumulative count of Article Views (full-text article views including HTML views, PDF and ePub downloads, according to the available data) and Abstracts Views on Vision4Press platform.
Data correspond to usage on the plateform after 2015. The current usage metrics is available 48-96 hours after online publication and is updated daily on week days.
Initial download of the metrics may take a while.