Fig. 9
Download original image
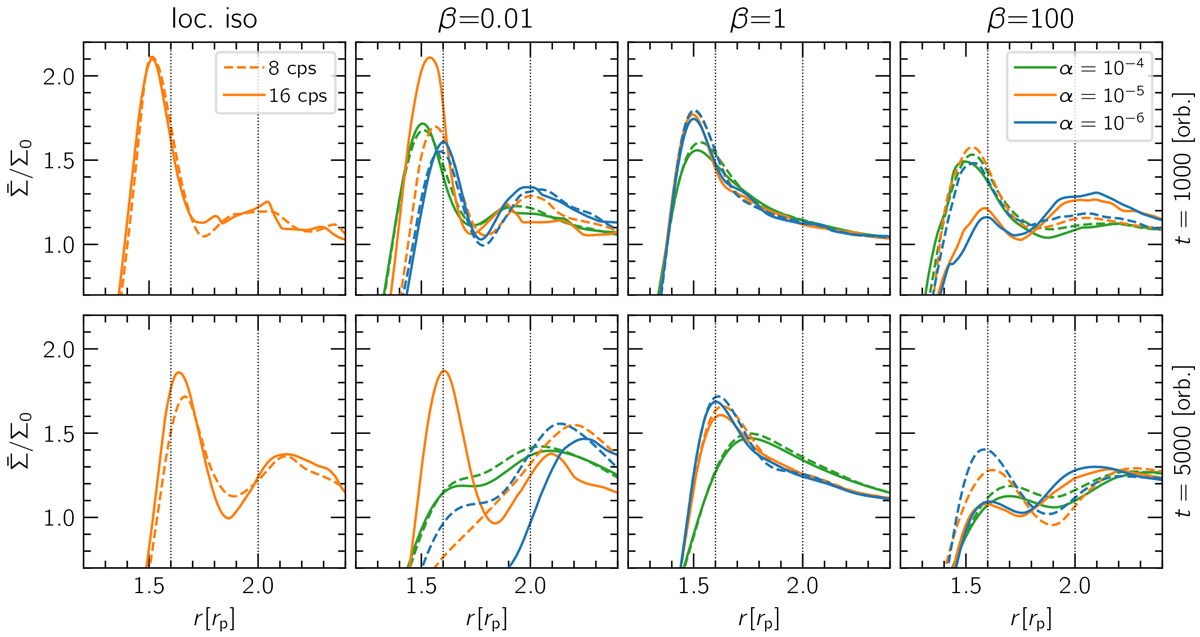
Azimuthally averaged surface density profiles as a function of different physical (α, β) and numerical (cps) parameters at two different time-stamps. The peak around r∕rp = 1.5–1.6 corresponds to the pressure bump formed by the planet as the latter pushes material away, forming a gap around its orbit. The smaller, secondary peak at around r∕rp = 2.1 is caused by the vortex that forms near the primary, planet-generated bump. Top: radial profiles at t = 1000 orbits. At this stage, all models pictured feature a vortex near the primary bump. We note the absence of a secondary bump for the models with β = 1. Bottom: same profiles at t = 5000 orbits. Here, the primary bump has moved radially outwards as the planet’s gap gets deeper and wider. We highlight the depletion of gas near the primary pressure bump for the second panel from the left (β = 0.01). This is caused by the combination of a vortex migrating outwards to the secondary bump, and the inability of the planet to resupply that zone with material from its now-depleted gap region. We also note the difference between resolutions of 8 and 16 cps (dashed and solid lines), especially for the β = 100 models and the β = 0.01, α = 10−5 model (the evolution of this model is shown as the orange line in Fig. 8).
Current usage metrics show cumulative count of Article Views (full-text article views including HTML views, PDF and ePub downloads, according to the available data) and Abstracts Views on Vision4Press platform.
Data correspond to usage on the plateform after 2015. The current usage metrics is available 48-96 hours after online publication and is updated daily on week days.
Initial download of the metrics may take a while.