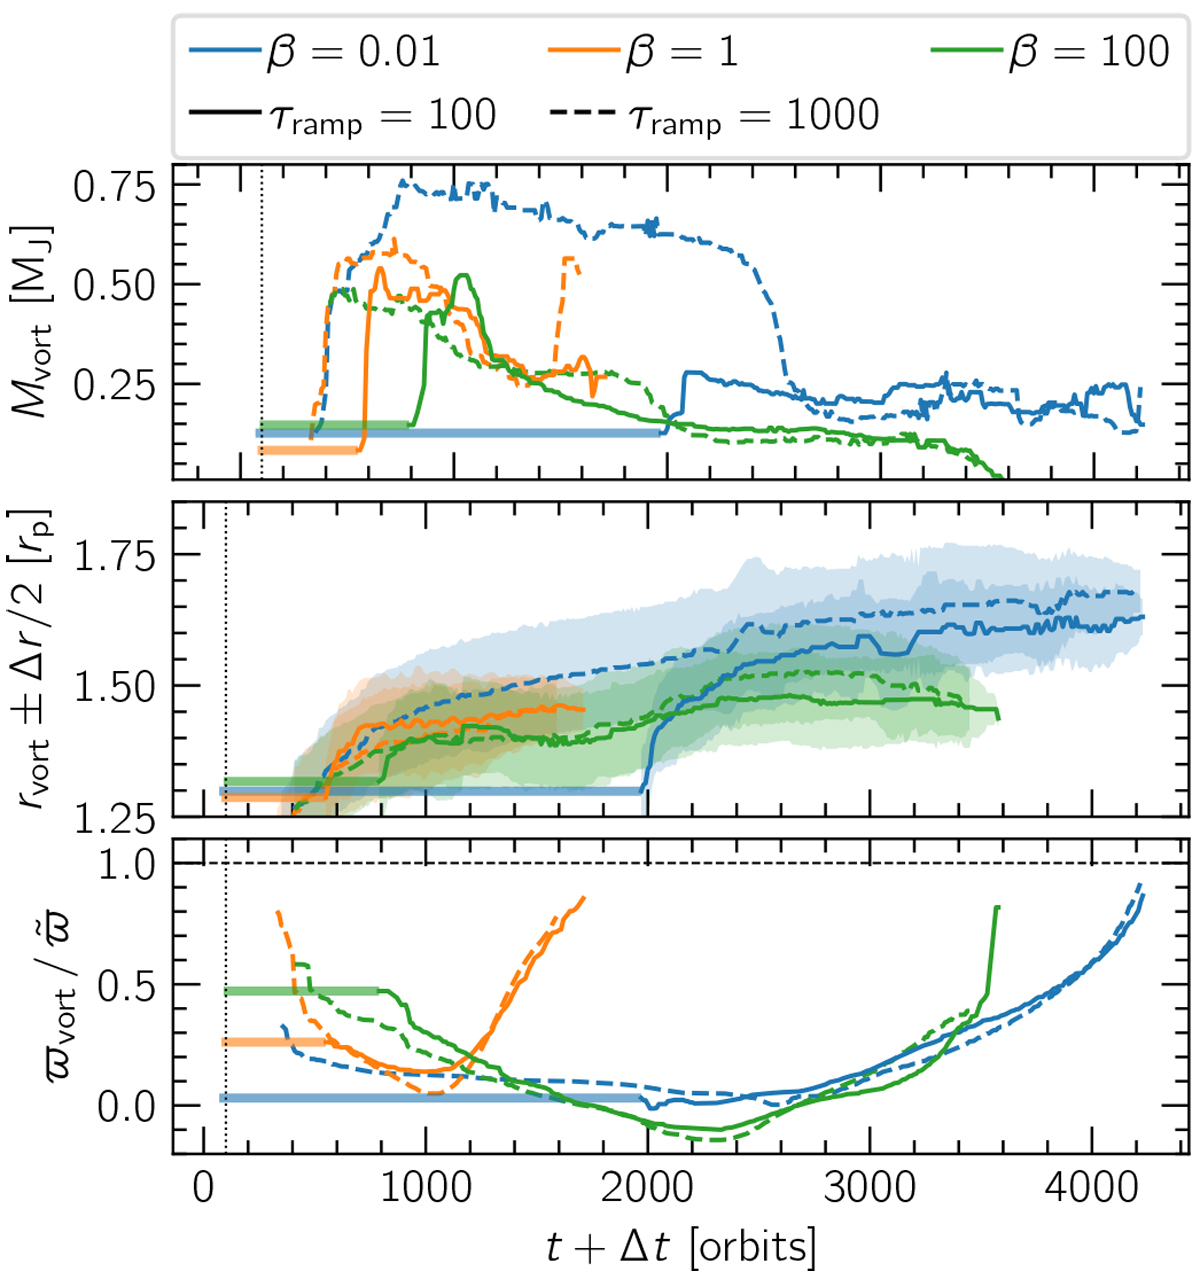
Fig. 6
Download original image
Influence of the planet introduction time on the evolution of vortex properties. The panels are as in Fig. 3. Solid and dashed lines show models with τramp = 100 orbits and 1000 orbits, respectively. The τramp = 100 orbits curves are shifted to the right (see the horizontal lines) to illustrate that the curves have the same shape in the decay phase, independent of τramp. We note that the final evolution of the vortex, after it has reached its minimum in vortensity, is the same independent of planet introduction time.
Current usage metrics show cumulative count of Article Views (full-text article views including HTML views, PDF and ePub downloads, according to the available data) and Abstracts Views on Vision4Press platform.
Data correspond to usage on the plateform after 2015. The current usage metrics is available 48-96 hours after online publication and is updated daily on week days.
Initial download of the metrics may take a while.