Fig. 4
Download original image
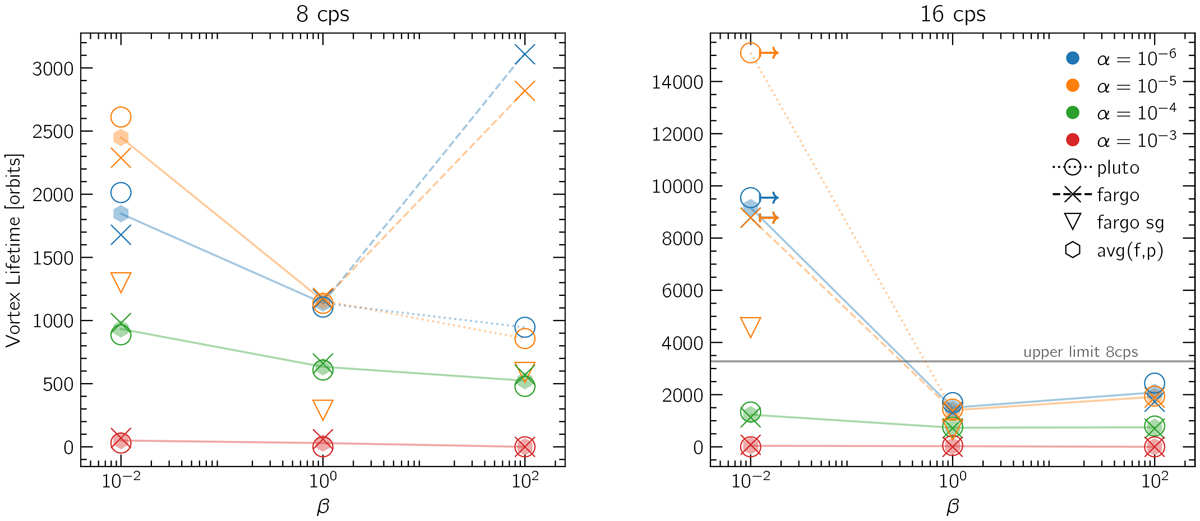
Lifetime of vortices as a function of β for 8 cps (left) and 16 cps resolution (right). Colors encode α, and the different symbols denote the code and the inclusion of self-gravity. The solid lines help guide the eye and connect the lifetime averages between the two codes (without self-gravity) for each value of α, where thetwo codes agree sufficiently. For parameters where there is a difference between the codes, dashed and dotted lines connect to the datapoints of the FargoCPT and PLUTO runs, respectively. A “↦ ” next to a symbol marks models that were terminated due to runtime constraints but still contain an active vortex. The horizontal gray line in the right panel indicates the top of the y-axis of the left panel. A list of all vortex lifetimes shown here is provided in Table C.1.
Current usage metrics show cumulative count of Article Views (full-text article views including HTML views, PDF and ePub downloads, according to the available data) and Abstracts Views on Vision4Press platform.
Data correspond to usage on the plateform after 2015. The current usage metrics is available 48-96 hours after online publication and is updated daily on week days.
Initial download of the metrics may take a while.