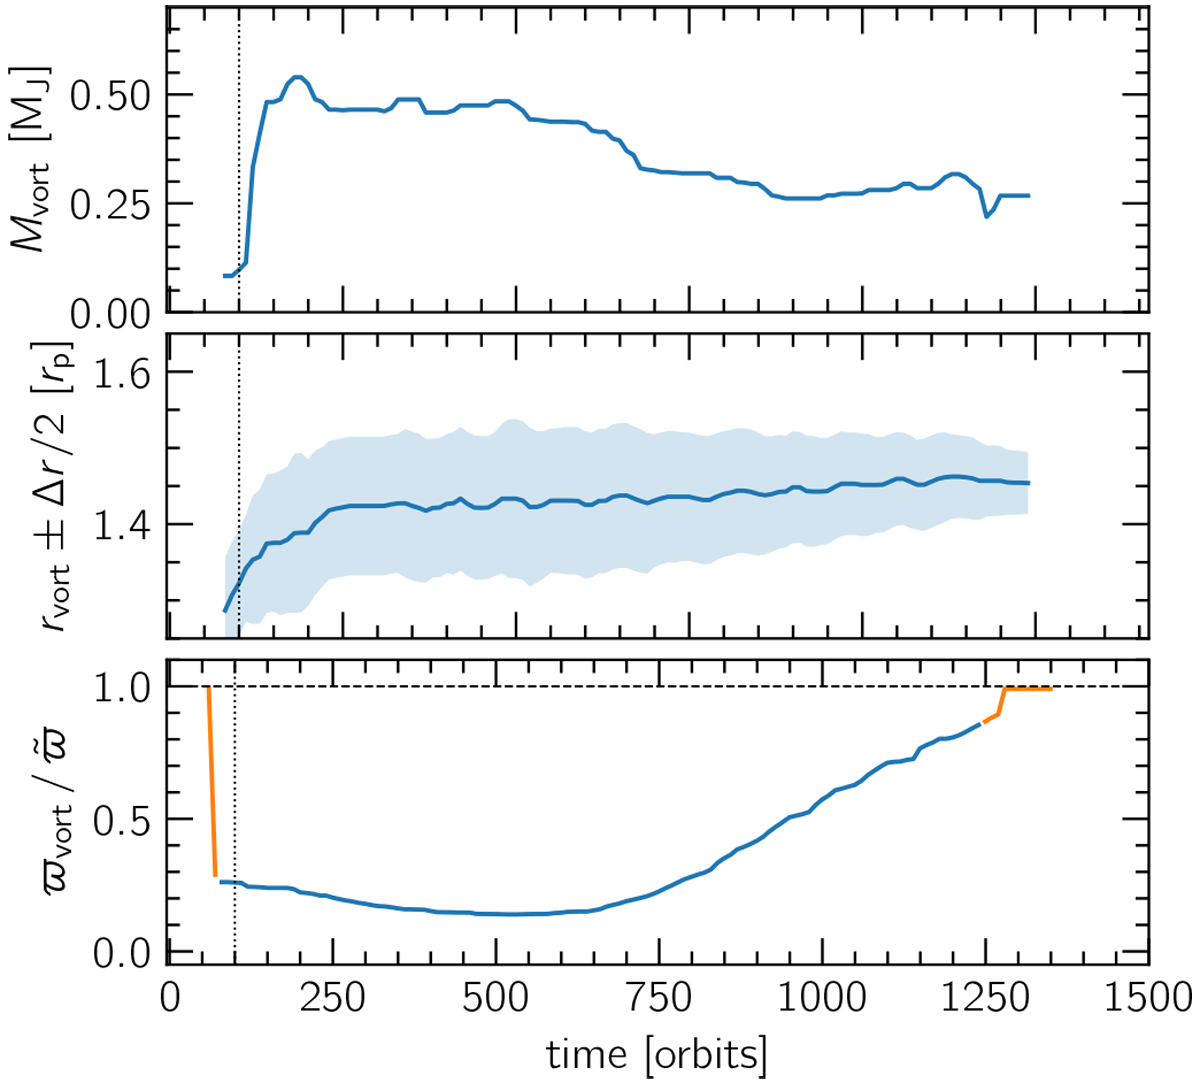
Fig. 3
Download original image
Evolution of vortex properties for the showcase simulations presented in Sect. 3. The panels show, from top to bottom, the mass enclosed in the FWHM ellipse of the vortex fit Mvort in Jupiter masses, the radial location of the vortex rvort, and its FWHM Δr, indicated by the shaded area, and the ratio between minimum vortensity inside the vortex and the azimuthal median of vortensity at the radial location of the vortensity minimum. A dotted vertical line indicates the time when the planet has reached its final mass. The curves are smoothed with a median filter that spans over the preceding and following five datapoints (± 50 orbits at rp). The orange parts of the line in the bottom panel show the evolution of the vortensity prior to the “birth” and after the “death” of the vortex.
Current usage metrics show cumulative count of Article Views (full-text article views including HTML views, PDF and ePub downloads, according to the available data) and Abstracts Views on Vision4Press platform.
Data correspond to usage on the plateform after 2015. The current usage metrics is available 48-96 hours after online publication and is updated daily on week days.
Initial download of the metrics may take a while.