Fig. 2
Download original image
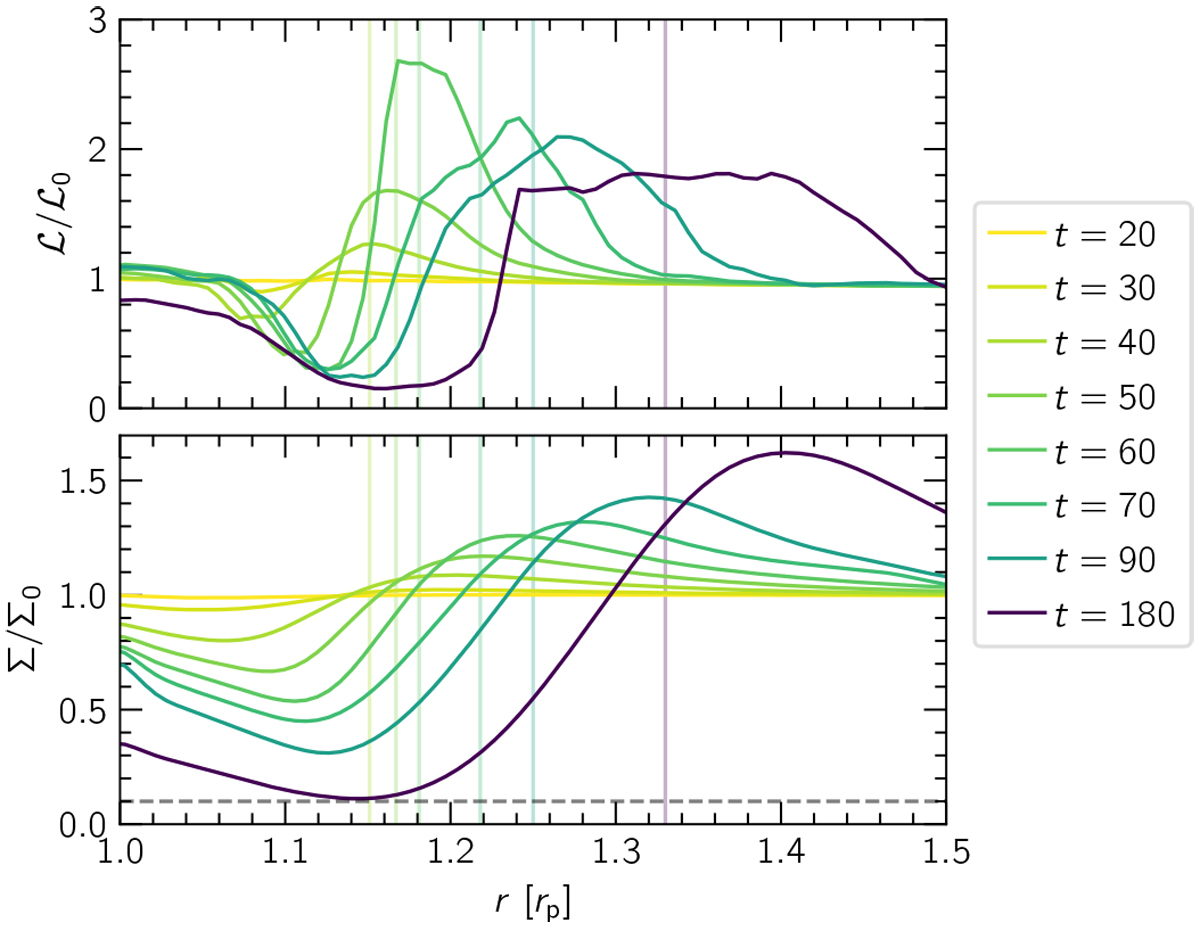
Evolution of radial Lovelace parameter (see Eq. (8)) and Σ
profiles during vortex formation over the first 200 orbits of the sample case from Sect. 3. The vertical lines indicate the center of the plateau in
![]() (estimated by eye) to guide the eye to the corresponding location of the
Σ
profile.
(estimated by eye) to guide the eye to the corresponding location of the
Σ
profile. ![]() is calculated as the azimuthal average at each radius. The dotted horizontal line in the bottom panel marks 10% of Σ0, which we define as the location of the gap edge.
is calculated as the azimuthal average at each radius. The dotted horizontal line in the bottom panel marks 10% of Σ0, which we define as the location of the gap edge.
Current usage metrics show cumulative count of Article Views (full-text article views including HTML views, PDF and ePub downloads, according to the available data) and Abstracts Views on Vision4Press platform.
Data correspond to usage on the plateform after 2015. The current usage metrics is available 48-96 hours after online publication and is updated daily on week days.
Initial download of the metrics may take a while.