Fig. B.2
Download original image
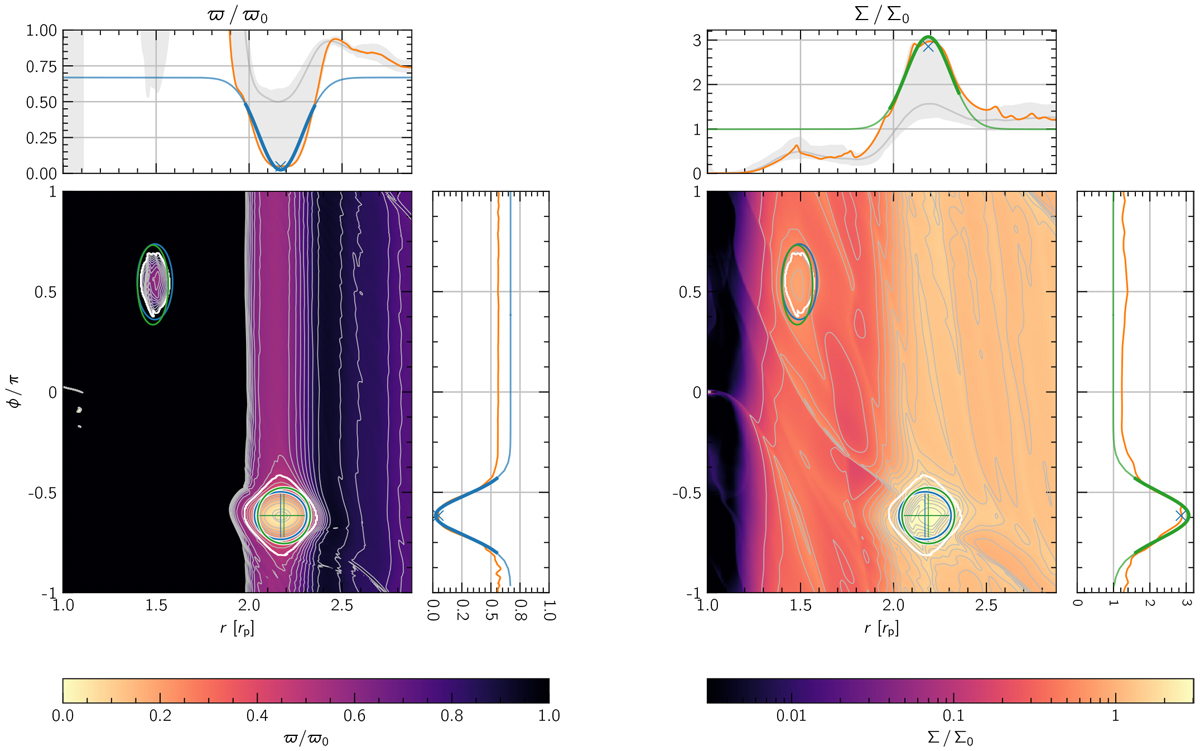
Overview of the results produced by the Vortector package for a model showing a secondary vortex discussed in Sect. 5 at t = 7150 orbits, with a 2D map of the vortensity on the left and surface density on the right. All detected vortex candidates are indicated in the 2D plots. The extracted contour (shown in Fig. B.1) is marked with a white line, the ellipse of the vortensity fit is shown in blue and the ellipse of the surface density fit is shown in green. Note that these ellipses are defined by σr and σϕ from the fit of Eq. (B.2) and are different from the ellipse used to fit the contour. The ellipses of the most massive vortex include a crosshair indicating the center of the fit. Each 2D plot is accompanied by 1D plots of slices through the main vortex. The plots also show the values of the respective Gaussian fit in blue for vortensity and green for surface density. In this figure, the planet is located at r = 1 and ϕ = 0.
Current usage metrics show cumulative count of Article Views (full-text article views including HTML views, PDF and ePub downloads, according to the available data) and Abstracts Views on Vision4Press platform.
Data correspond to usage on the plateform after 2015. The current usage metrics is available 48-96 hours after online publication and is updated daily on week days.
Initial download of the metrics may take a while.