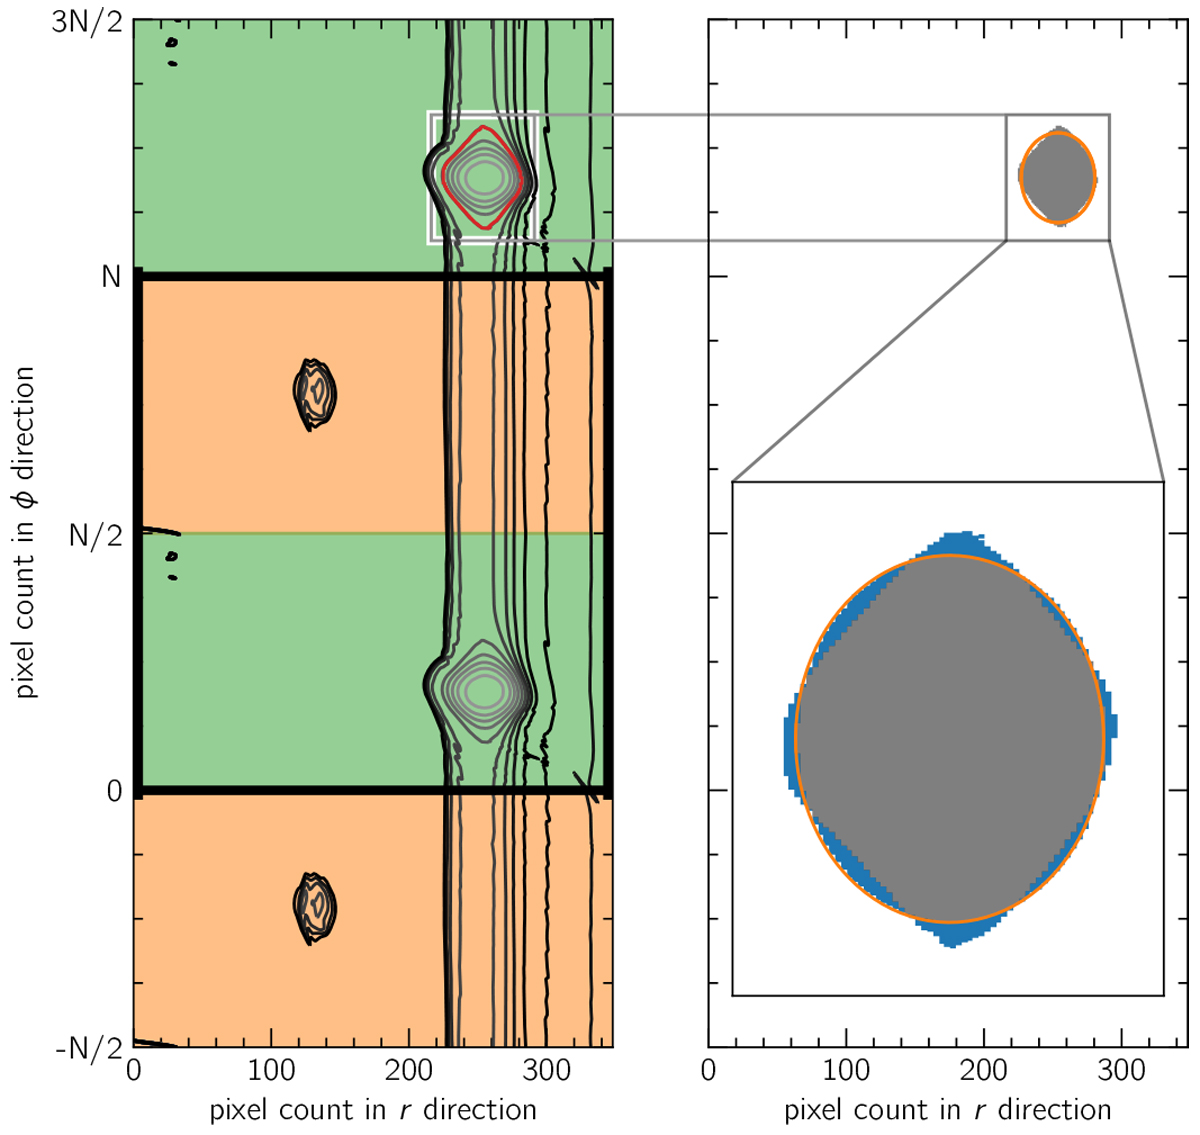
Fig. B.1
Download original image
Periodically continued iso-vortensity line image (left) used for extracting contours for vortex candidates and an example contour illustrating the ellipse fit (right). The snapshot shown is at time t = 7150 orbits of the model with the secondary vortex that was discussed in Sect. 5. The left panel shows how the data array is mirrored in order to allow the detection of vortices that overlap with the periodic boundary. Areas with the same color are copies of one another. The red line indicates the outline of the grey area in the right panel. The original size is marked by the black rectangle ranging from 0 to N on the vertical axis. The area shaded in blue in the right panel illustrates the definition of the deviation from the ellipse that is used to select the vortex candidates from the closed contours. For the example shown, the ratio of difference area (blue) to the total contour area is 0.122, which is below the 0.15 threshold.
Current usage metrics show cumulative count of Article Views (full-text article views including HTML views, PDF and ePub downloads, according to the available data) and Abstracts Views on Vision4Press platform.
Data correspond to usage on the plateform after 2015. The current usage metrics is available 48-96 hours after online publication and is updated daily on week days.
Initial download of the metrics may take a while.