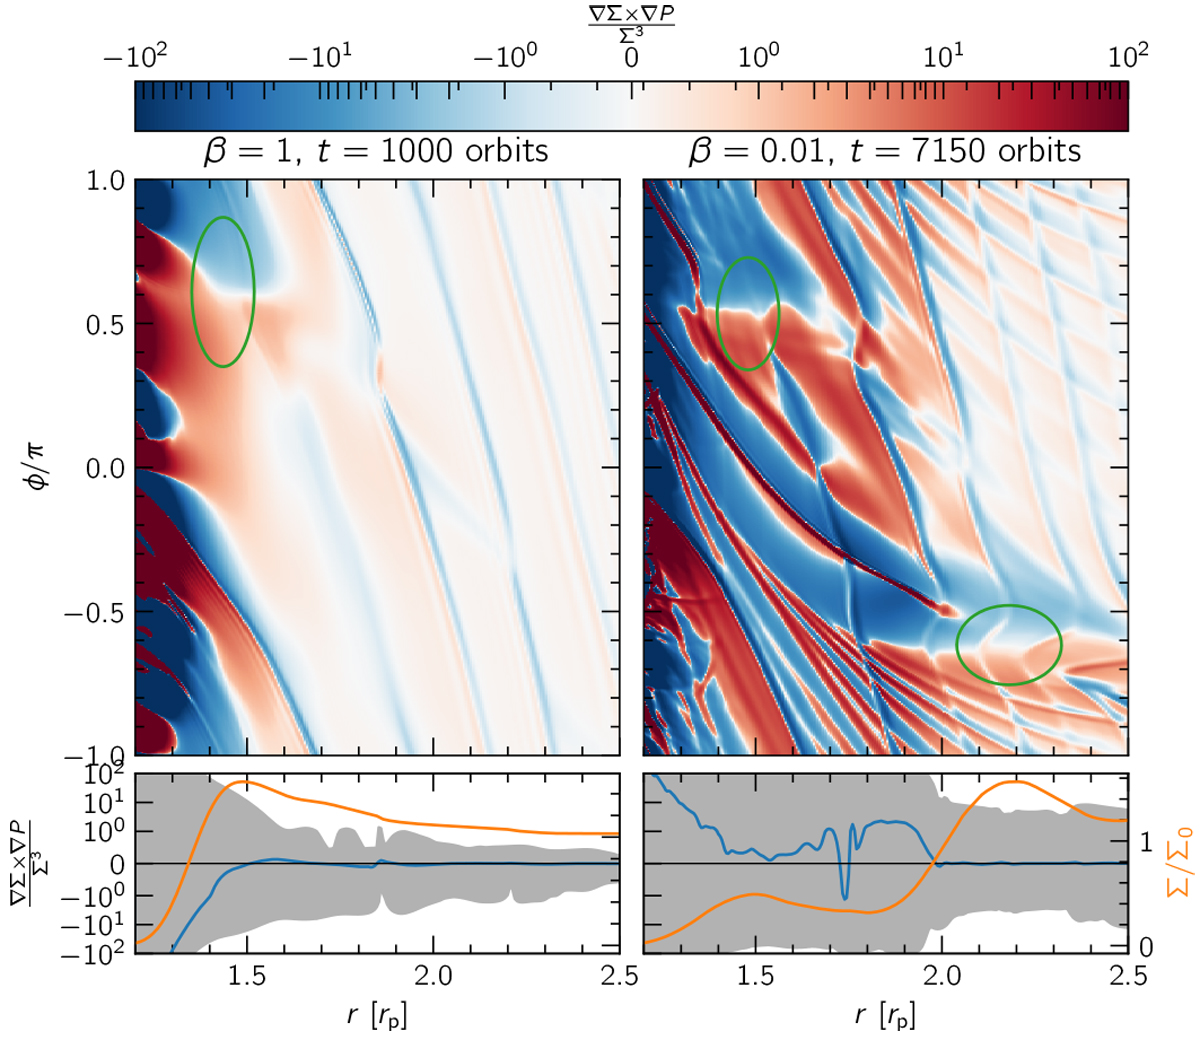
Fig. 10
Download original image
Baroclinic term (RHS of Eq. (10)) in the outer disk for a short-lived model (β = 1 at t = 1000 orbits) and a long-lived vortex (β = 0.01 at t = 7150 orbits, see also Fig. B.2) with α = 10−5 and 16 cps resolution on the left and right side, respectively. The top row shows maps of the baroclinic term with the detected vortices indicated with green ellipses as obtained from the Σ fit. The bottom row shows the radial Σ profile in orange, the azimuthally averaged baroclinic term in blue and the region between its minimum and maximum shaded in gray.
Current usage metrics show cumulative count of Article Views (full-text article views including HTML views, PDF and ePub downloads, according to the available data) and Abstracts Views on Vision4Press platform.
Data correspond to usage on the plateform after 2015. The current usage metrics is available 48-96 hours after online publication and is updated daily on week days.
Initial download of the metrics may take a while.