Fig. 4.
Download original image
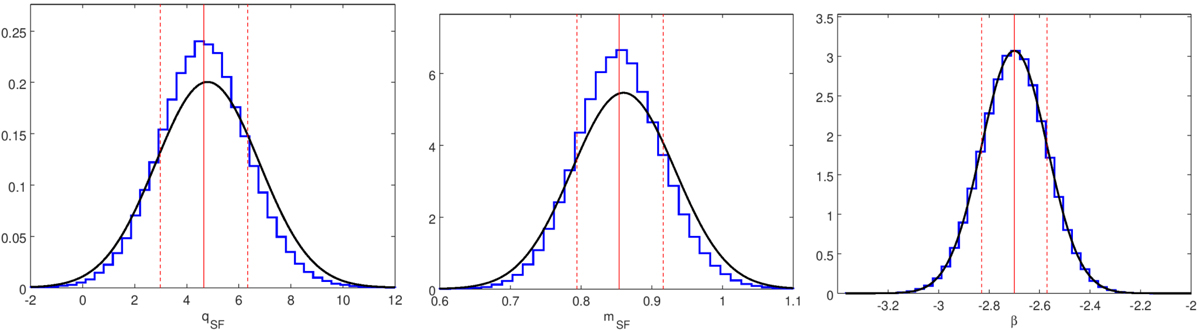
PDFs (blue histograms) of those jump parameters entering as coefficients in Eqs. (5) and (6). Left and middle panels: intercept qSF and slope mSF of Eq. (6). Right panel: β exponent of Eq. (5). The median and the ±1-σ bounds of each PDF are marked as vertical solid and dashed red lines, respectively. The black Gaussians represent the priors inferred from observations for each empirical parameter.
Current usage metrics show cumulative count of Article Views (full-text article views including HTML views, PDF and ePub downloads, according to the available data) and Abstracts Views on Vision4Press platform.
Data correspond to usage on the plateform after 2015. The current usage metrics is available 48-96 hours after online publication and is updated daily on week days.
Initial download of the metrics may take a while.