Fig. 4
Download original image
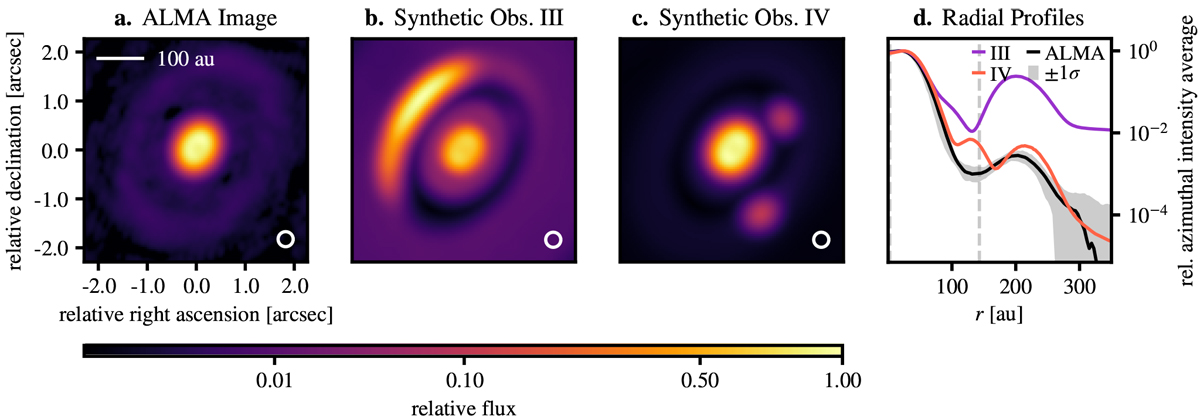
Outcome of the simulations including two planets. We positioned the inner planet at 13 au with a mass of 8MJup and the outer planet at 143 au with 1.7 MJup (positions marked in panel d as dashed vertical lines). The planets form at the same time and equally fast, but the initial density profile is assumed differently in the two compared setups: the initial density profile for simulation III was a power-law, while simulation IV started as a self-similar solution profile. The inconsistent bump, shown as the red curve centered on the position of the outer planets, is an artifact of the lacking accretion process in the simulation, as can be concluded based on the results of Bergez-Casalou et al. (2020), who have shown the effect of accretion on the gap formation process. They found that when the accretion process is included in the simulation, the gap is cleared out completely for a disk setup like ours. The accumulation at the position of the planet would therefore not be observed in reality.
Current usage metrics show cumulative count of Article Views (full-text article views including HTML views, PDF and ePub downloads, according to the available data) and Abstracts Views on Vision4Press platform.
Data correspond to usage on the plateform after 2015. The current usage metrics is available 48-96 hours after online publication and is updated daily on week days.
Initial download of the metrics may take a while.