Fig. 4
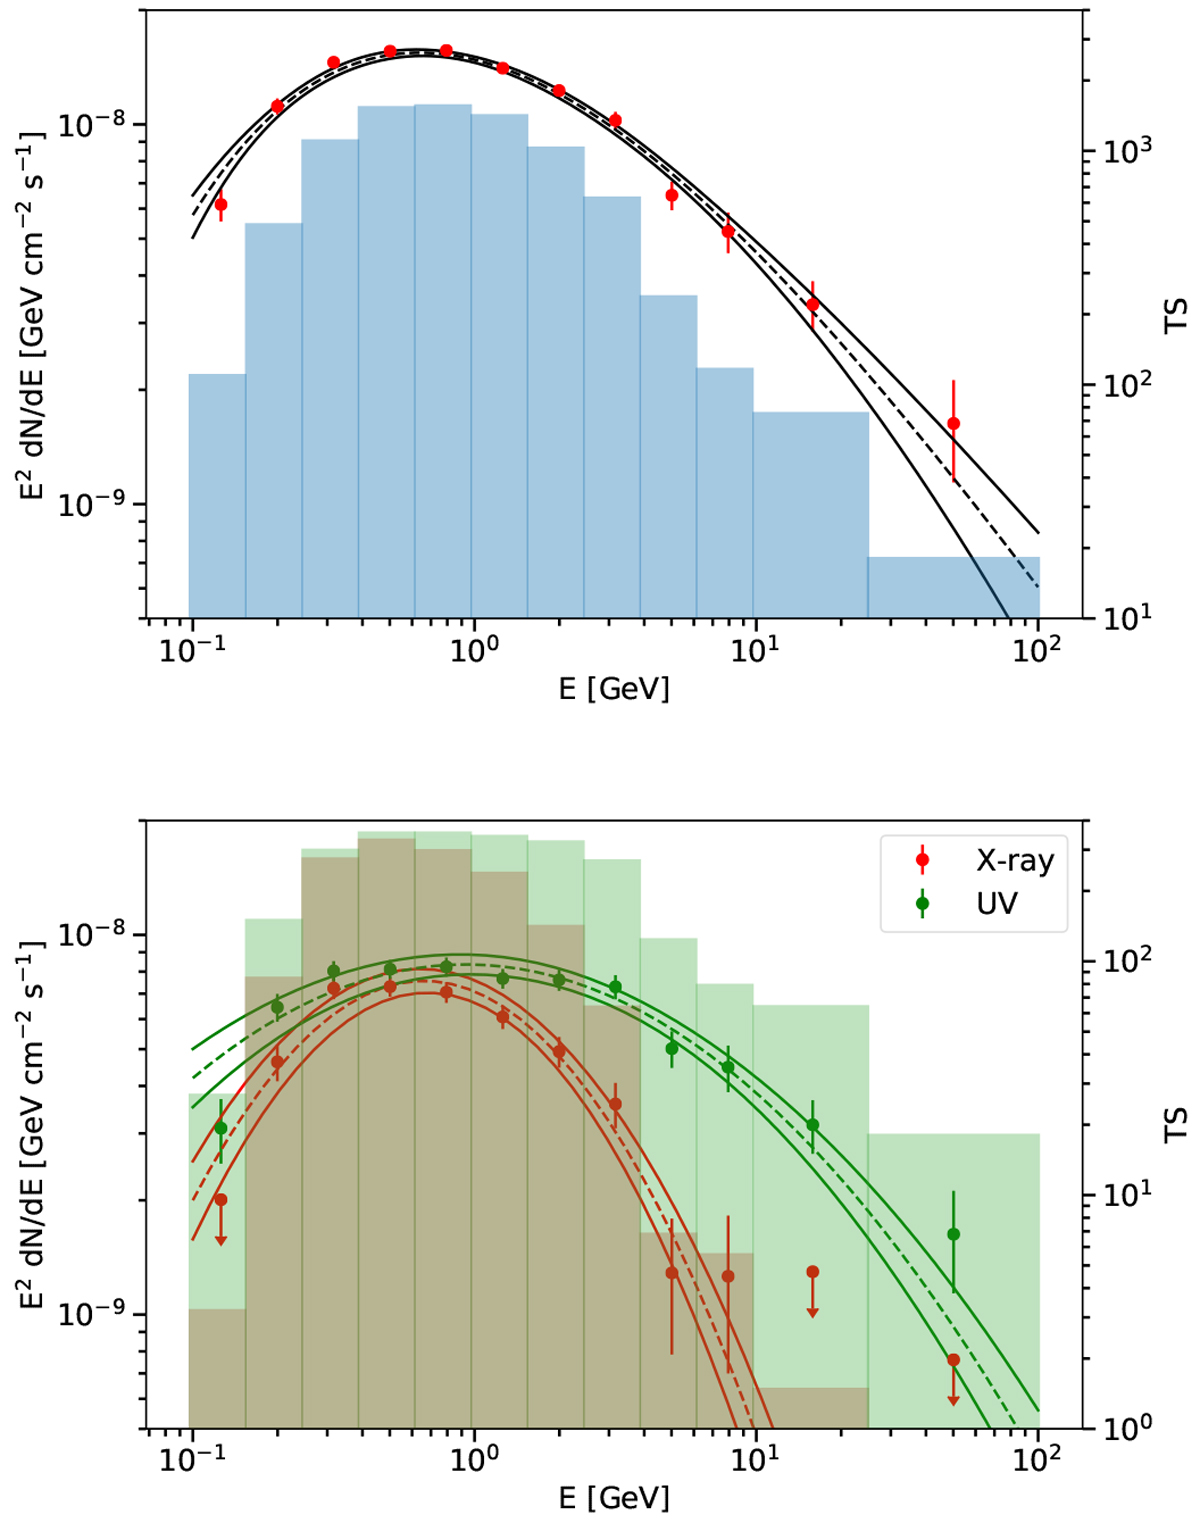
Download original image
Spectral energy distribution of the γ-ray emission measured with the LAT for the Cygnus Loop. The filled histograms show the TS values in each energy bin. Vertical barsshow 1σ statistical errors. Where the detection is not significant (TS < 4), we show upper limits at the 95% confidence level. Upperpanel: SED extracted using the UV template. The PLSuperExpCutoff4 best-fit spectrum for the global γ-ray data (Table 3) is plotted as the dashed black line, and its upper and lower 1σ bounds asthe solid black lines. Lower panel: red (green) points are LAT flux points using the X-ray (UV) maps as spatial templates together. The lines are the best-fit LogParabola models (Table 4).
Current usage metrics show cumulative count of Article Views (full-text article views including HTML views, PDF and ePub downloads, according to the available data) and Abstracts Views on Vision4Press platform.
Data correspond to usage on the plateform after 2015. The current usage metrics is available 48-96 hours after online publication and is updated daily on week days.
Initial download of the metrics may take a while.