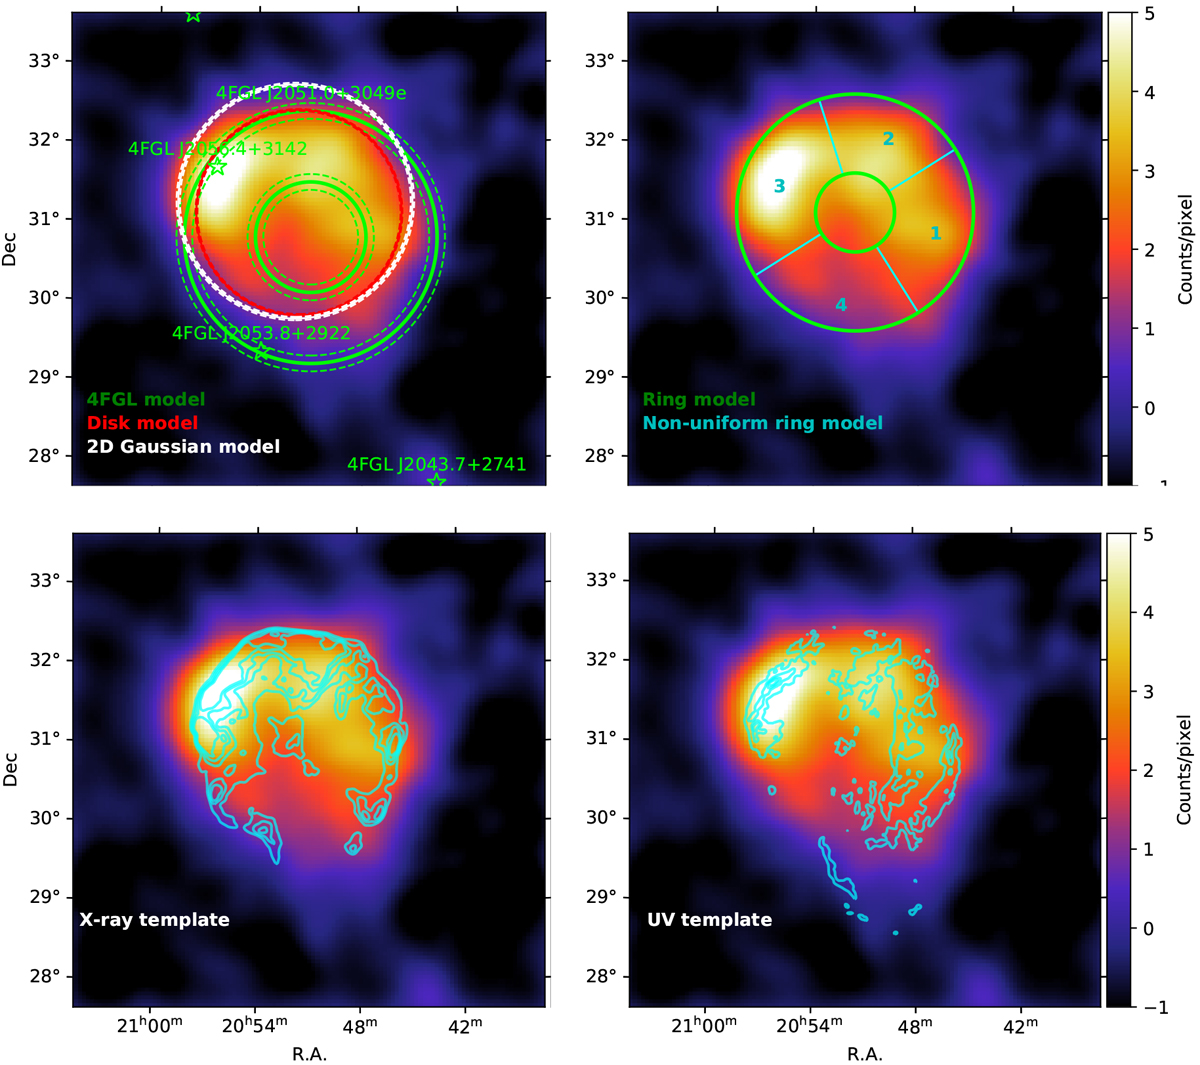
Fig. 3
Download original image
Residual count map in a 6° × 6° (pixel size of 0.05°) region around the Cygnus Loop (smoothed with a Gaussian kernel of 0.2°) obtained from 0.1 to 100 GeV. The Cygnus Loop was not included in the model (null hypothesis). Different templates are overlaid. Top left: best-fit disk and Gaussian models represented in red and white, respectively. The 4FGL point sources are shown as green stars. The ring model (4FGL J2051.0+3049e) introduced by Katagiri et al. (2011) is shown in green. Top right: best-fit ring model (green). The blue lines define the four sections used in Tables 1 and 2. Bottom left: contours of the ROSAT X-ray template (cyan, see Sect. 2.2). The templates were smoothed with a Gaussian kernel of σ = 0.2° to make the contours more regular. Contours for the X-ray template are at 30%, 20%, 10%, and 1% of the maximum. Bottom right: contours for the GALEX UV template (cyan, see Sect. 2.3) are at 40%, 25%, 15%, and 2% of the maximum.
Current usage metrics show cumulative count of Article Views (full-text article views including HTML views, PDF and ePub downloads, according to the available data) and Abstracts Views on Vision4Press platform.
Data correspond to usage on the plateform after 2015. The current usage metrics is available 48-96 hours after online publication and is updated daily on week days.
Initial download of the metrics may take a while.