Fig. 2
Download original image
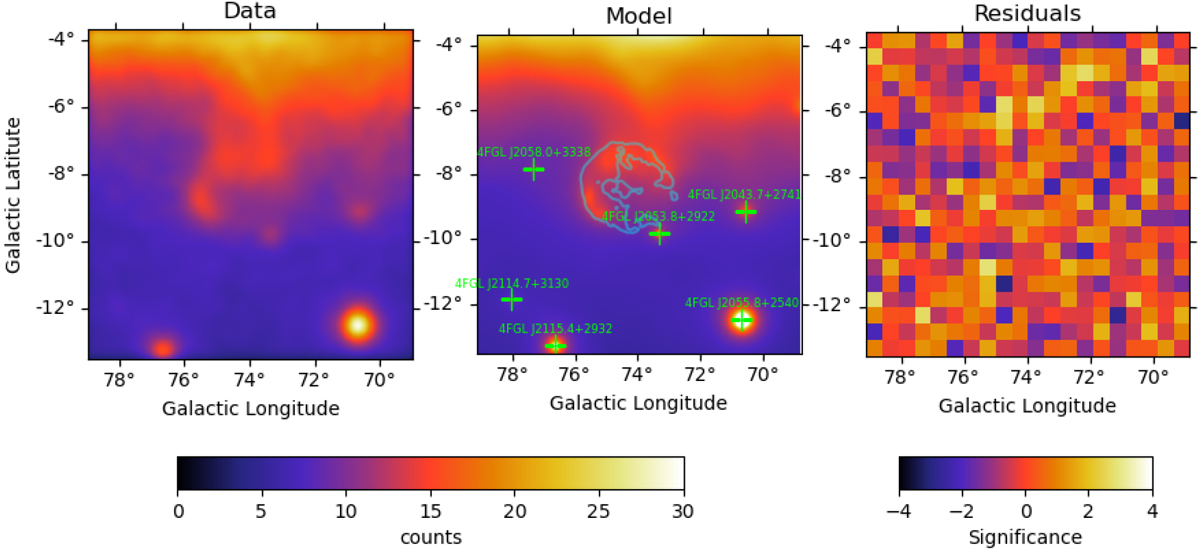
Maps of a 10° × 10° region around the Cygnus Loop. Left: count map (pixel size of 0.05°) smoothed with a Gaussian kernel of 0.2° from 0.1 to 100 GeV. Center: count map expected from the X-ray+UV model (same spatial binning as the left map). Green crosses indicate the positions of γ-ray sources listed in the 4FGL catalogue. The cyan line is the contour (10% of the maximum) of the ROSAT X-ray template of the Cygnus Loop (see Sect. 2.2). Right: residual count map from the X-ray+UV template model (pixel size of 0.5°).
Current usage metrics show cumulative count of Article Views (full-text article views including HTML views, PDF and ePub downloads, according to the available data) and Abstracts Views on Vision4Press platform.
Data correspond to usage on the plateform after 2015. The current usage metrics is available 48-96 hours after online publication and is updated daily on week days.
Initial download of the metrics may take a while.