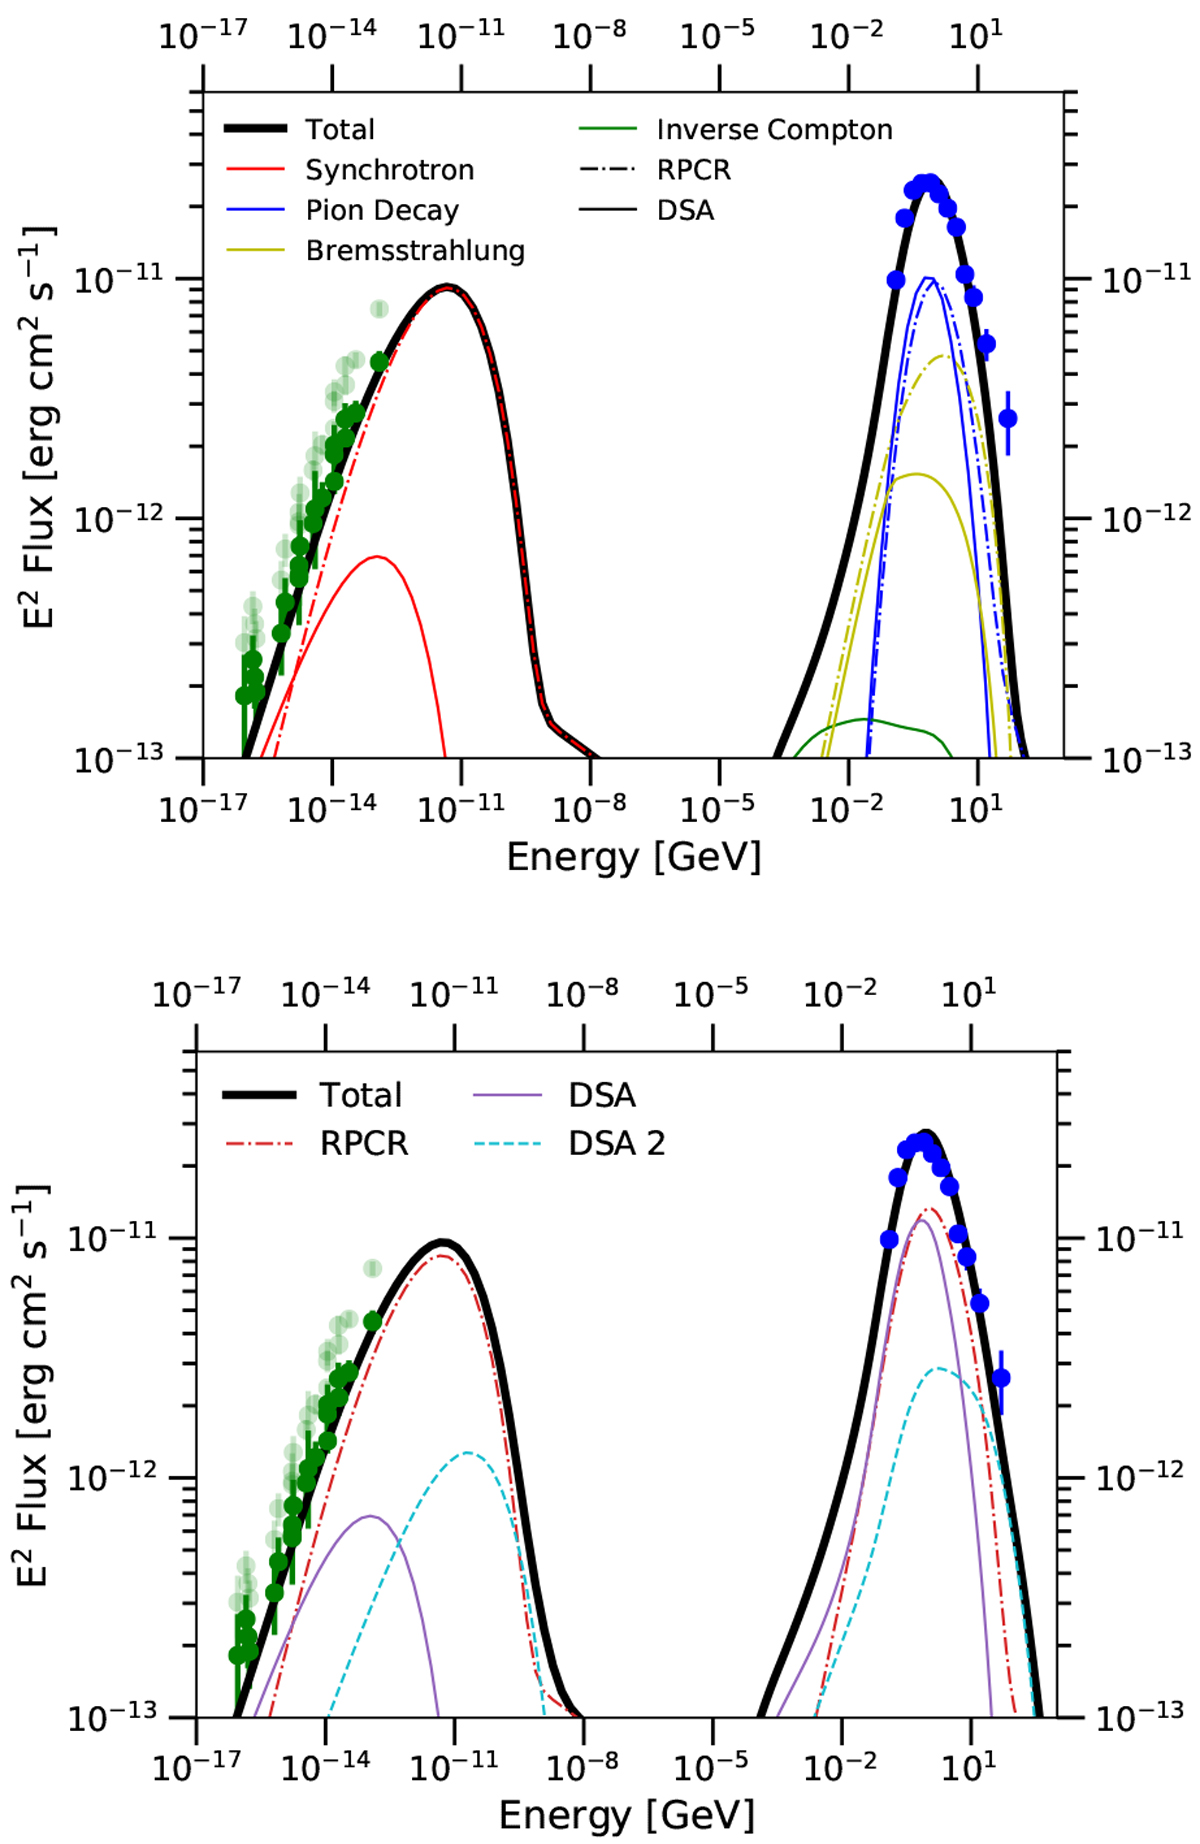
Fig. 12
Download original image
Same as Fig. 11, but the multiwavelength model has multiple contributions. Upper panel: DSA scenario (solid lines) and RPCR scenario (dot-dashed lines). The total contribution from the two scenarios is shown by the solid black line. Lower panel: same as the upper panel, but with contribution from the intercloud region (DSA 2).
Current usage metrics show cumulative count of Article Views (full-text article views including HTML views, PDF and ePub downloads, according to the available data) and Abstracts Views on Vision4Press platform.
Data correspond to usage on the plateform after 2015. The current usage metrics is available 48-96 hours after online publication and is updated daily on week days.
Initial download of the metrics may take a while.