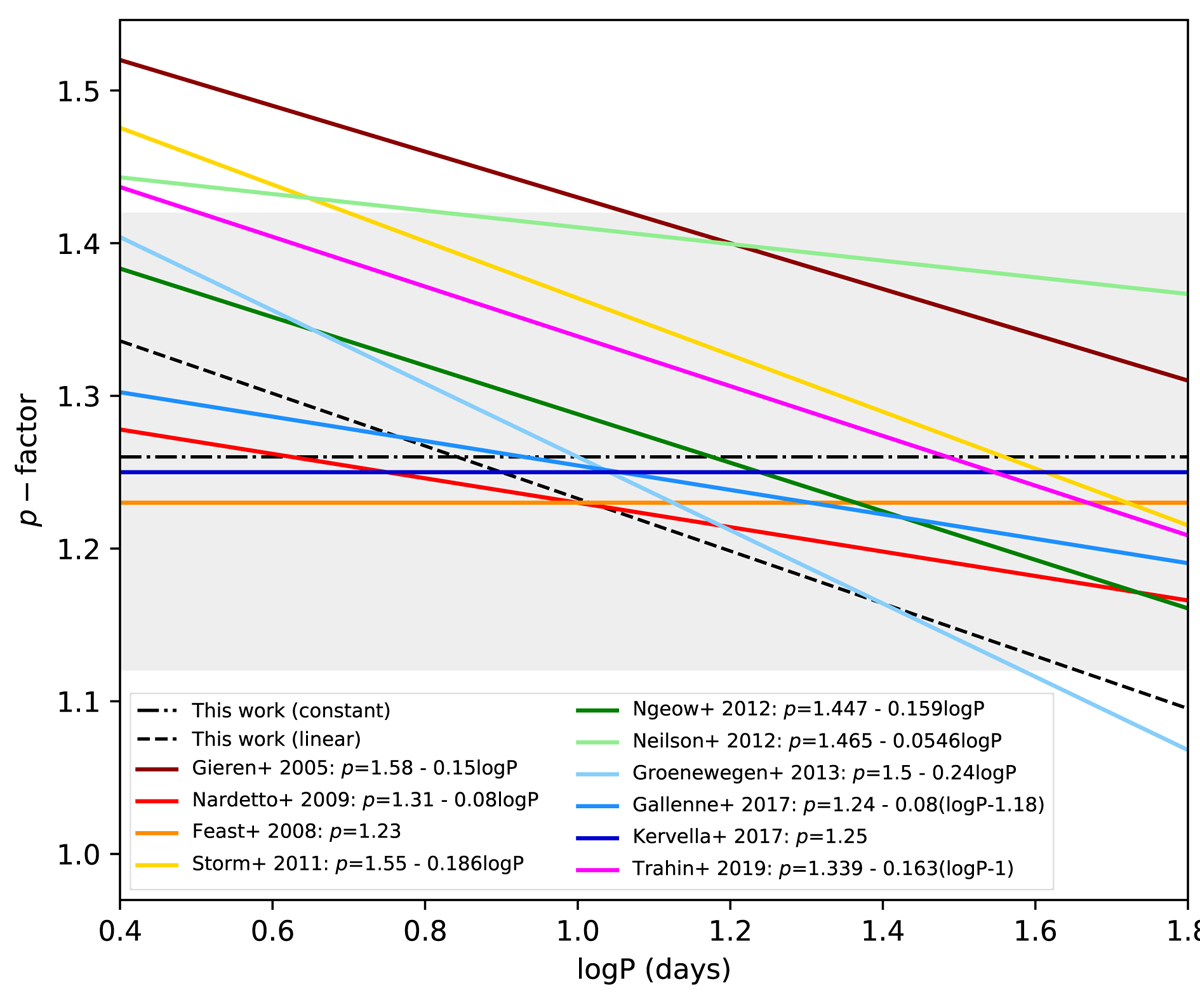
Fig. 7.
Download original image
Comparison of several period-p-factor relations found in the literature (Gieren et al. 2005; Nardetto et al. 2009; Feast et al. 2008; Storm et al. 2011; Ngeow et al. 2012; Neilson et al. 2012; Groenewegen 2013; Gallenne et al. 2017; Kervella et al. 2017; Trahin 2019). The gray region represents the dispersion of the values around p = 1.26 derived in this study.
Current usage metrics show cumulative count of Article Views (full-text article views including HTML views, PDF and ePub downloads, according to the available data) and Abstracts Views on Vision4Press platform.
Data correspond to usage on the plateform after 2015. The current usage metrics is available 48-96 hours after online publication and is updated daily on week days.
Initial download of the metrics may take a while.