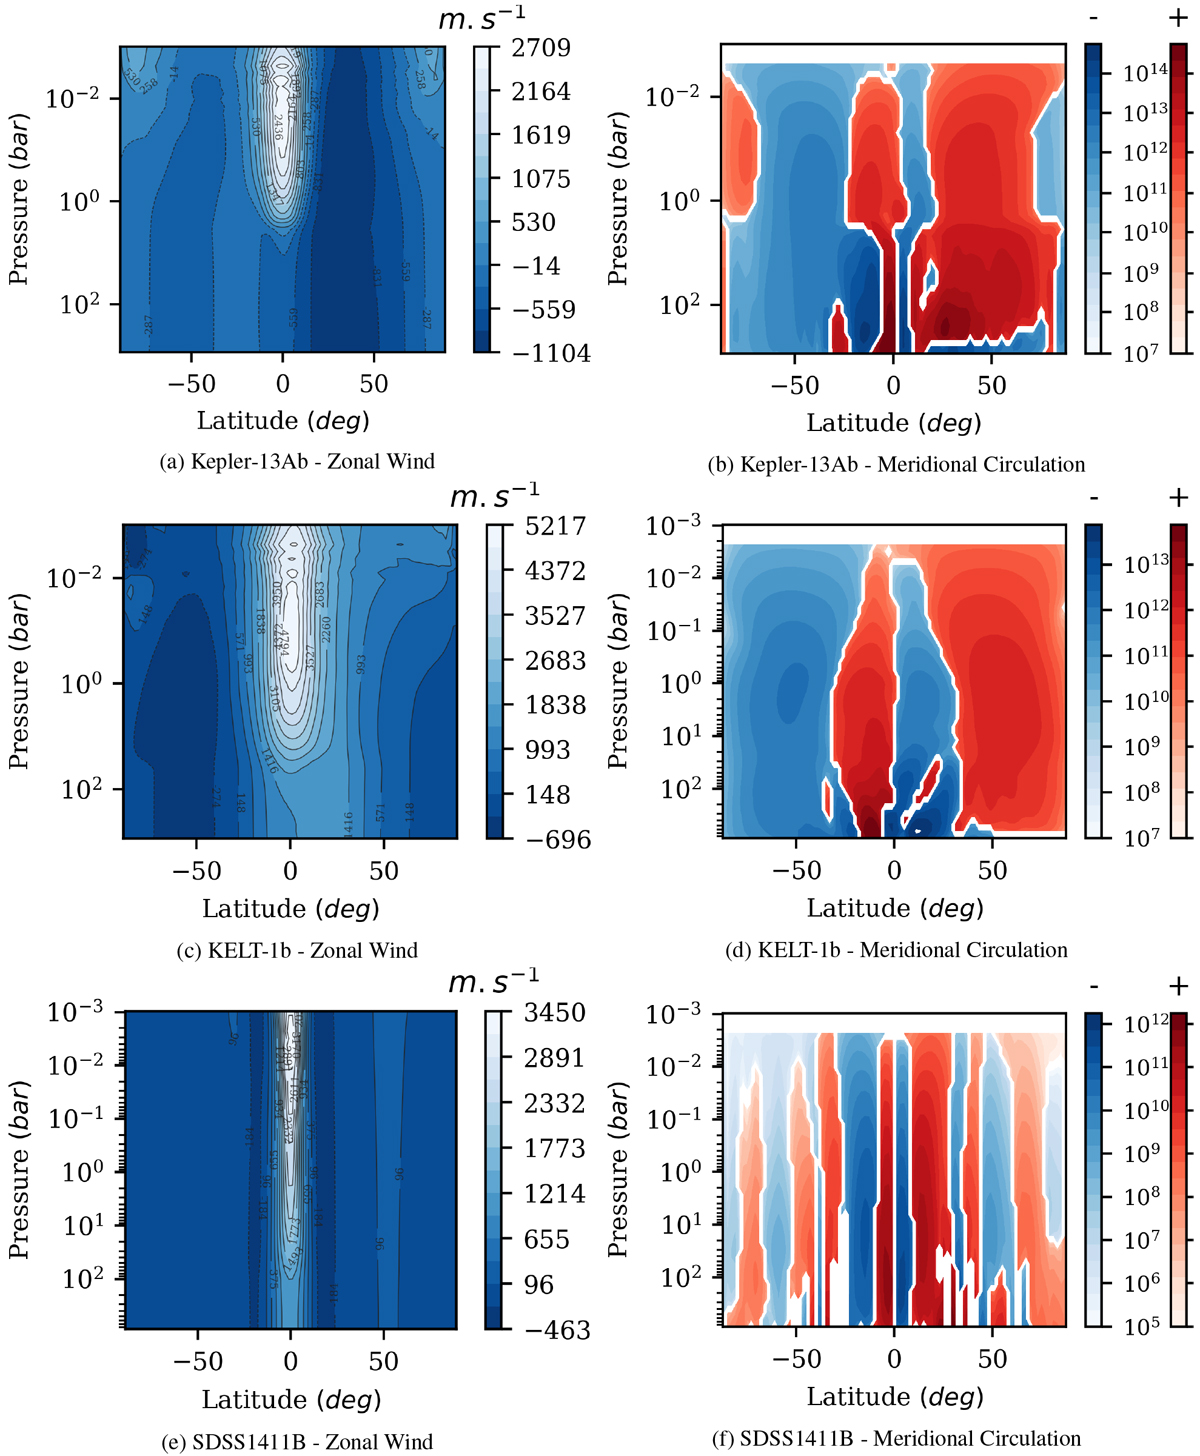
Fig. 10
Download original image
Zonally and temporally averaged (over a period of ~3 yr) zonal wind profiles (left) and meridional circulation streamfunctions (right) for Kepler-13Ab (top), KELT-1b (middle), and SDSS1411B (bottom). In the zonal wind profiles easterly winds are positive and westerly winds are negative, and in the meridional circulation profile, we plot the stream function using a logged scale in order to clearly illustrate the full circulation profile. Here, clockwise circulations are shown in red and anti-clockwise in blue – these circulations combine in all models to reveal an equatorial downflow at all pressures.
Current usage metrics show cumulative count of Article Views (full-text article views including HTML views, PDF and ePub downloads, according to the available data) and Abstracts Views on Vision4Press platform.
Data correspond to usage on the plateform after 2015. The current usage metrics is available 48-96 hours after online publication and is updated daily on week days.
Initial download of the metrics may take a while.