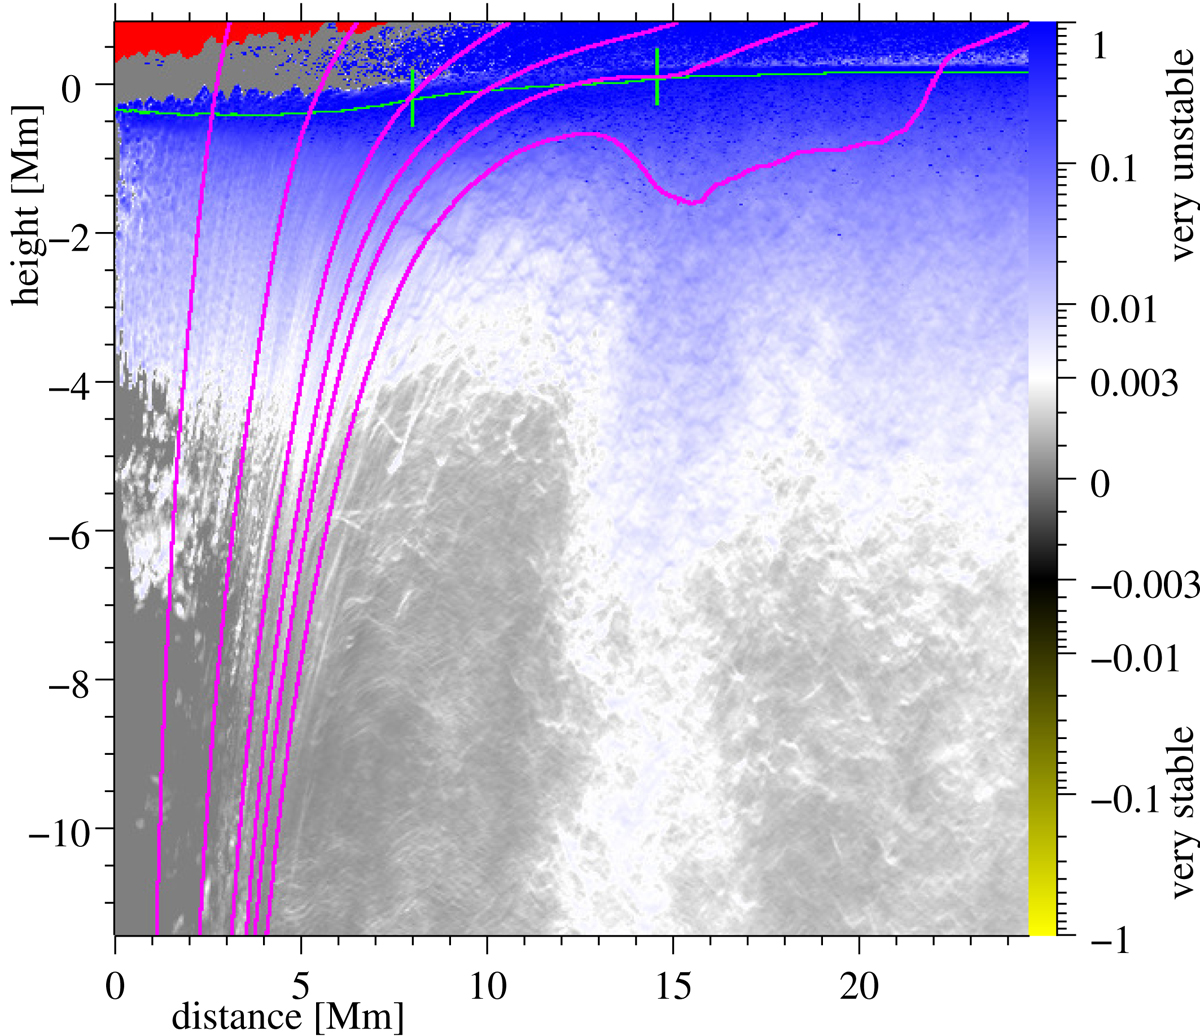
Fig. 4.
Download original image
Same as lower panel of Fig. 2, but here we plot the GT criterion as the azimuthal average over positive grid cell values around the spot. Cells with negative (stable) values are not considered. The horizontal green line represents the azimuthal average of the τ = 1 surface. The vertical green lines mark the average position of the umbral and spot boundaries. In magenta we draw flux surfaces, that contain 7, 28, 51, 62, 68, and 74% of the total flux respectively.
Current usage metrics show cumulative count of Article Views (full-text article views including HTML views, PDF and ePub downloads, according to the available data) and Abstracts Views on Vision4Press platform.
Data correspond to usage on the plateform after 2015. The current usage metrics is available 48-96 hours after online publication and is updated daily on week days.
Initial download of the metrics may take a while.