Fig. 2.
Download original image
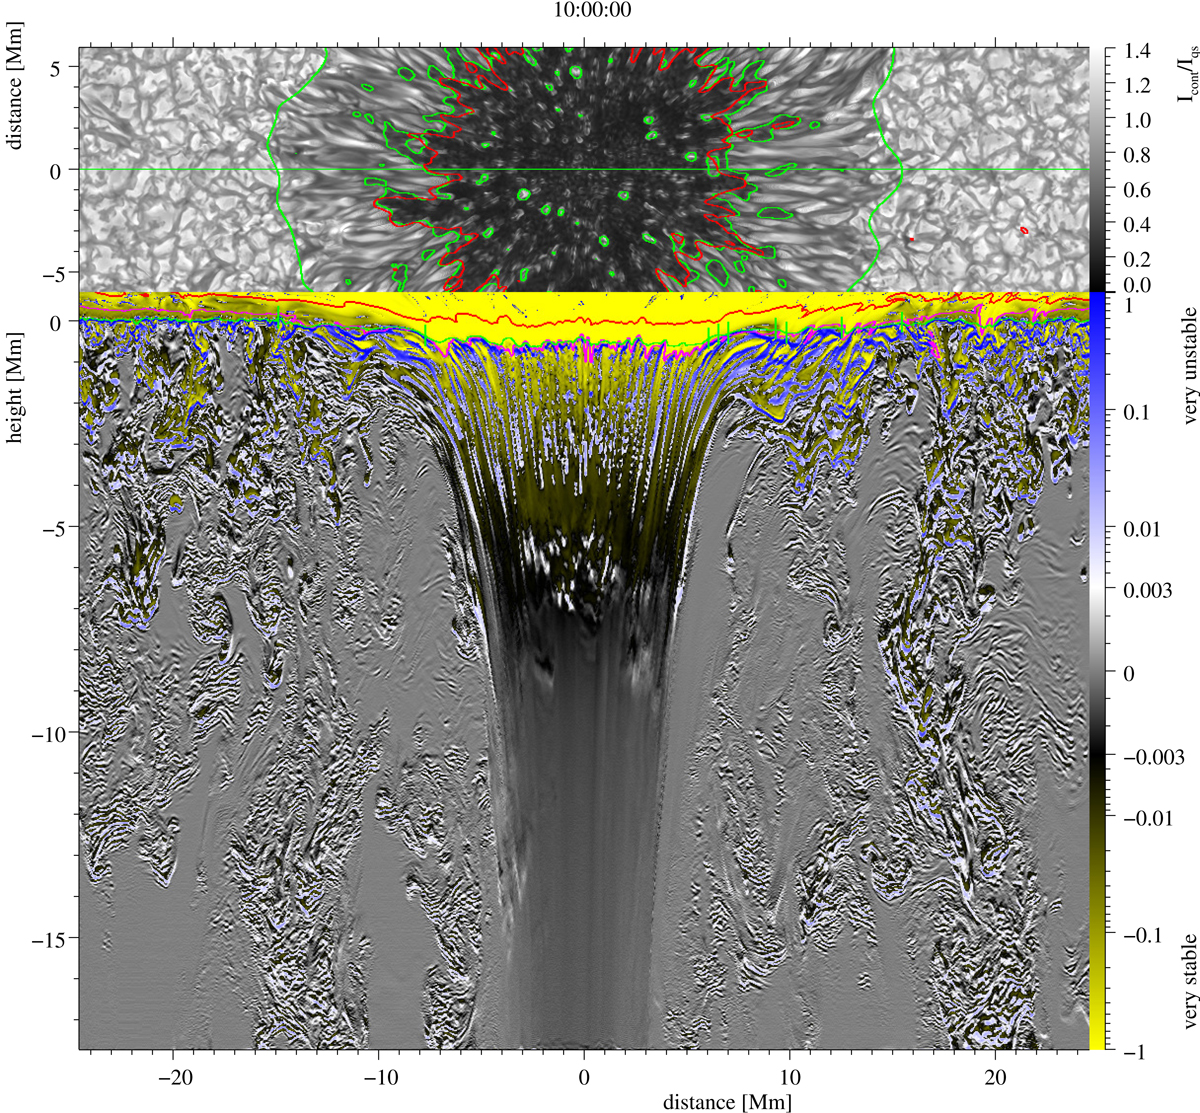
Sunspot showing partition into umbra, penumbra, and quiet sun as well as the magneto-convective stability of their sub-surface structure. Top: bolometric intensity Ic. Bottom: map of the GT stability shows the smaller of the LHSs of Eqs. (2) and (3) in a piece-wise logarithmic and linear colour scale from −1 to +1. The green lines are as in Fig. 1. The magenta contour marks the plasma β = 8πp/|B|2 = 1 surfaces. The red line marks the outer edge of the density ρ < 3 × 10⁻⁹ g cm−3 region. The time evolution of this figure is available as animation online.
Current usage metrics show cumulative count of Article Views (full-text article views including HTML views, PDF and ePub downloads, according to the available data) and Abstracts Views on Vision4Press platform.
Data correspond to usage on the plateform after 2015. The current usage metrics is available 48-96 hours after online publication and is updated daily on week days.
Initial download of the metrics may take a while.