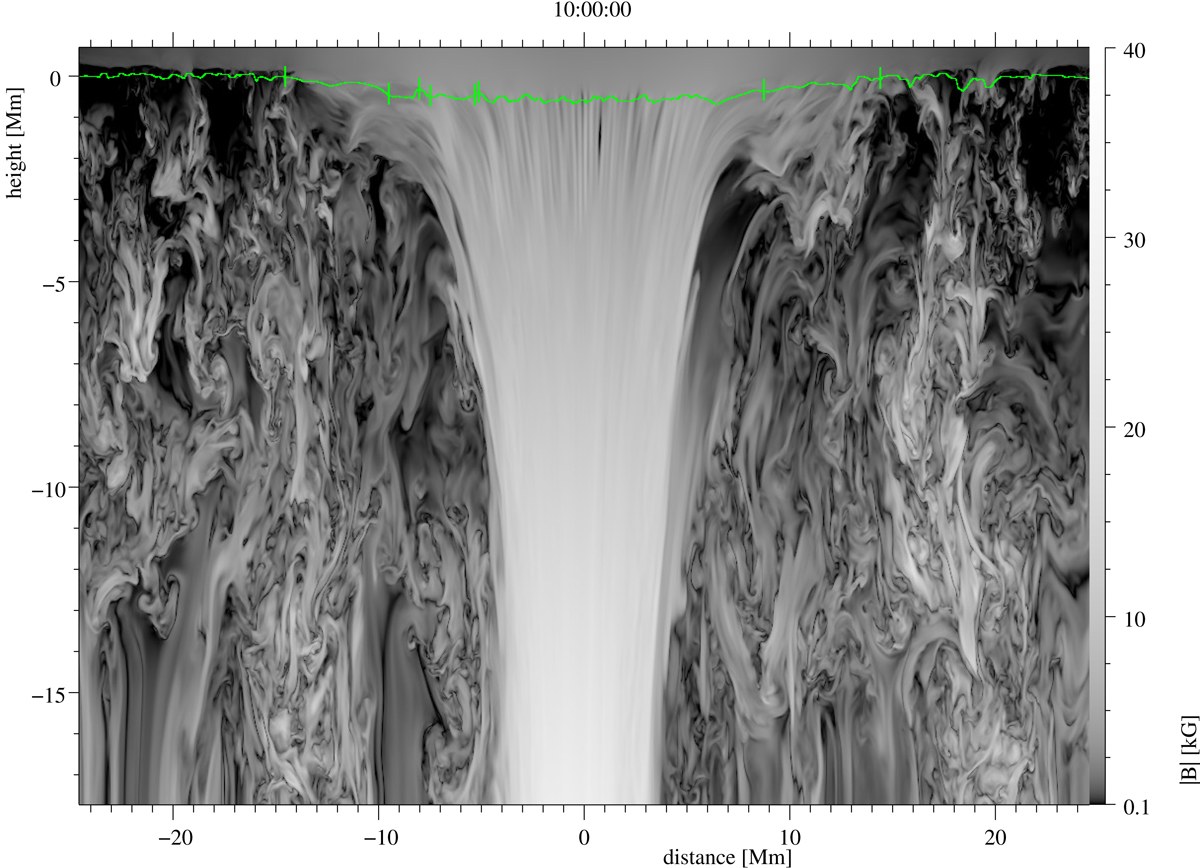
Fig. 1.
Download original image
Cross-section of the total magnetic field strength of our simulation after 10 h of solar time through the centre of the spot (same cut as in Fig. 2). The sunspot magnetic field funnels out with its height embedded in the (granular) background magnetic field filling the box. Vertical green lines mark the spot and umbral boundaries as seen in upper panel of Fig. 2. The horizontal green line marks the τ = 1 surface.
Current usage metrics show cumulative count of Article Views (full-text article views including HTML views, PDF and ePub downloads, according to the available data) and Abstracts Views on Vision4Press platform.
Data correspond to usage on the plateform after 2015. The current usage metrics is available 48-96 hours after online publication and is updated daily on week days.
Initial download of the metrics may take a while.