Fig. 7
Download original image
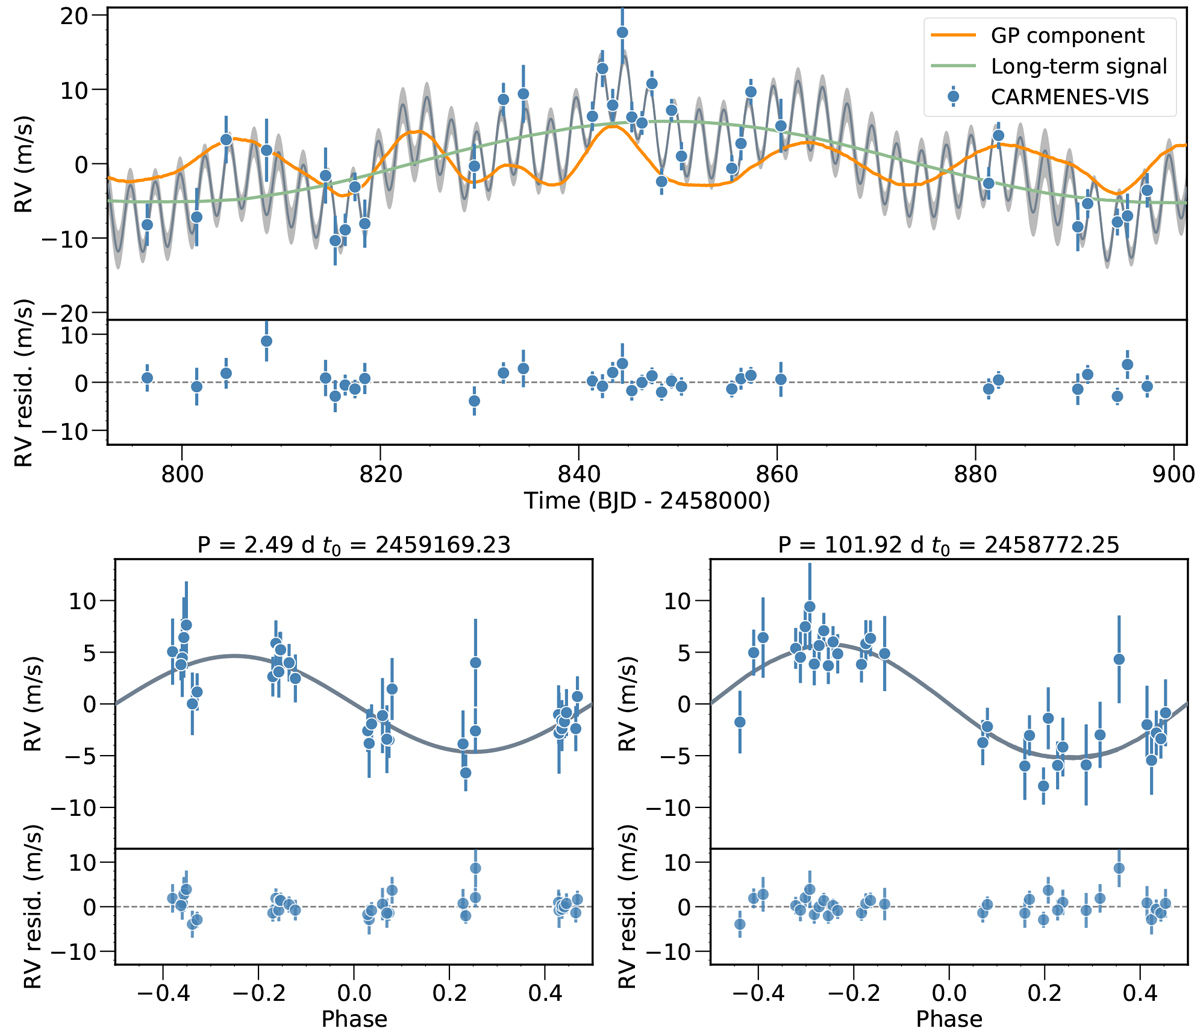
CARMENES RV data for TOI-1201 with the best-fit model from the joint fit overplotted (dark gray), the dSHO-GP component (orange), and the long-term signal (green). Top panel: RV time series. The light gray band represents the 68% credibility interval. Bottom panels: RVs phase-folded to the periods of the transiting planet (left) and long-term signal (right). The bottom panel of each plot shows the residuals after the model is subtracted.
Current usage metrics show cumulative count of Article Views (full-text article views including HTML views, PDF and ePub downloads, according to the available data) and Abstracts Views on Vision4Press platform.
Data correspond to usage on the plateform after 2015. The current usage metrics is available 48-96 hours after online publication and is updated daily on week days.
Initial download of the metrics may take a while.