Fig. 5
Download original image
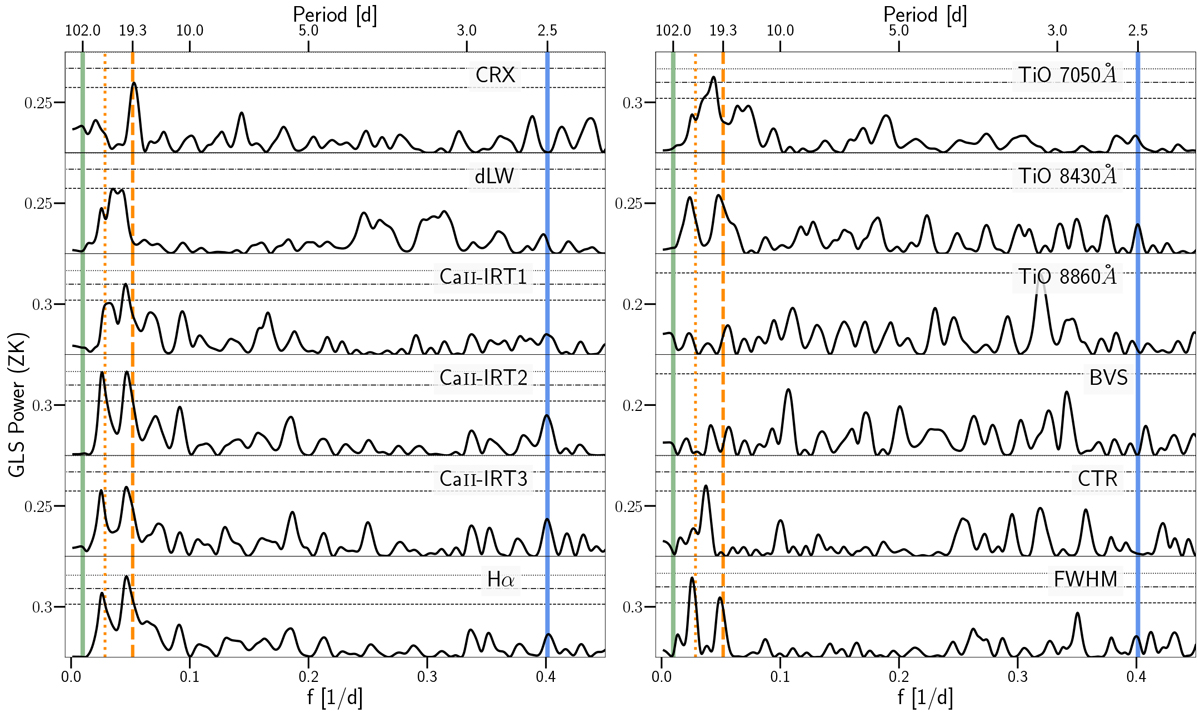
GLS periodograms of the various stellar activity indicators from the CARMENES spectroscopic data for TOI-1201. The vertical solid blue line corresponds to the transiting planet (2.49 d) and the green one to the long-term signal (~ 102 d) found in the RVs (Sect. 5.2). The vertical dashed and dotted orange lines correspond to the rotational period present in the RVs (~19 d) and its alias (~35 d), respectively.The horizontal dotted, dot-dashed, and dashed lines represent the 10, 1, and 0.1% FAP levels. The window function for the data set is displayed in Fig. 6.
Current usage metrics show cumulative count of Article Views (full-text article views including HTML views, PDF and ePub downloads, according to the available data) and Abstracts Views on Vision4Press platform.
Data correspond to usage on the plateform after 2015. The current usage metrics is available 48-96 hours after online publication and is updated daily on week days.
Initial download of the metrics may take a while.