Fig. 2
Download original image
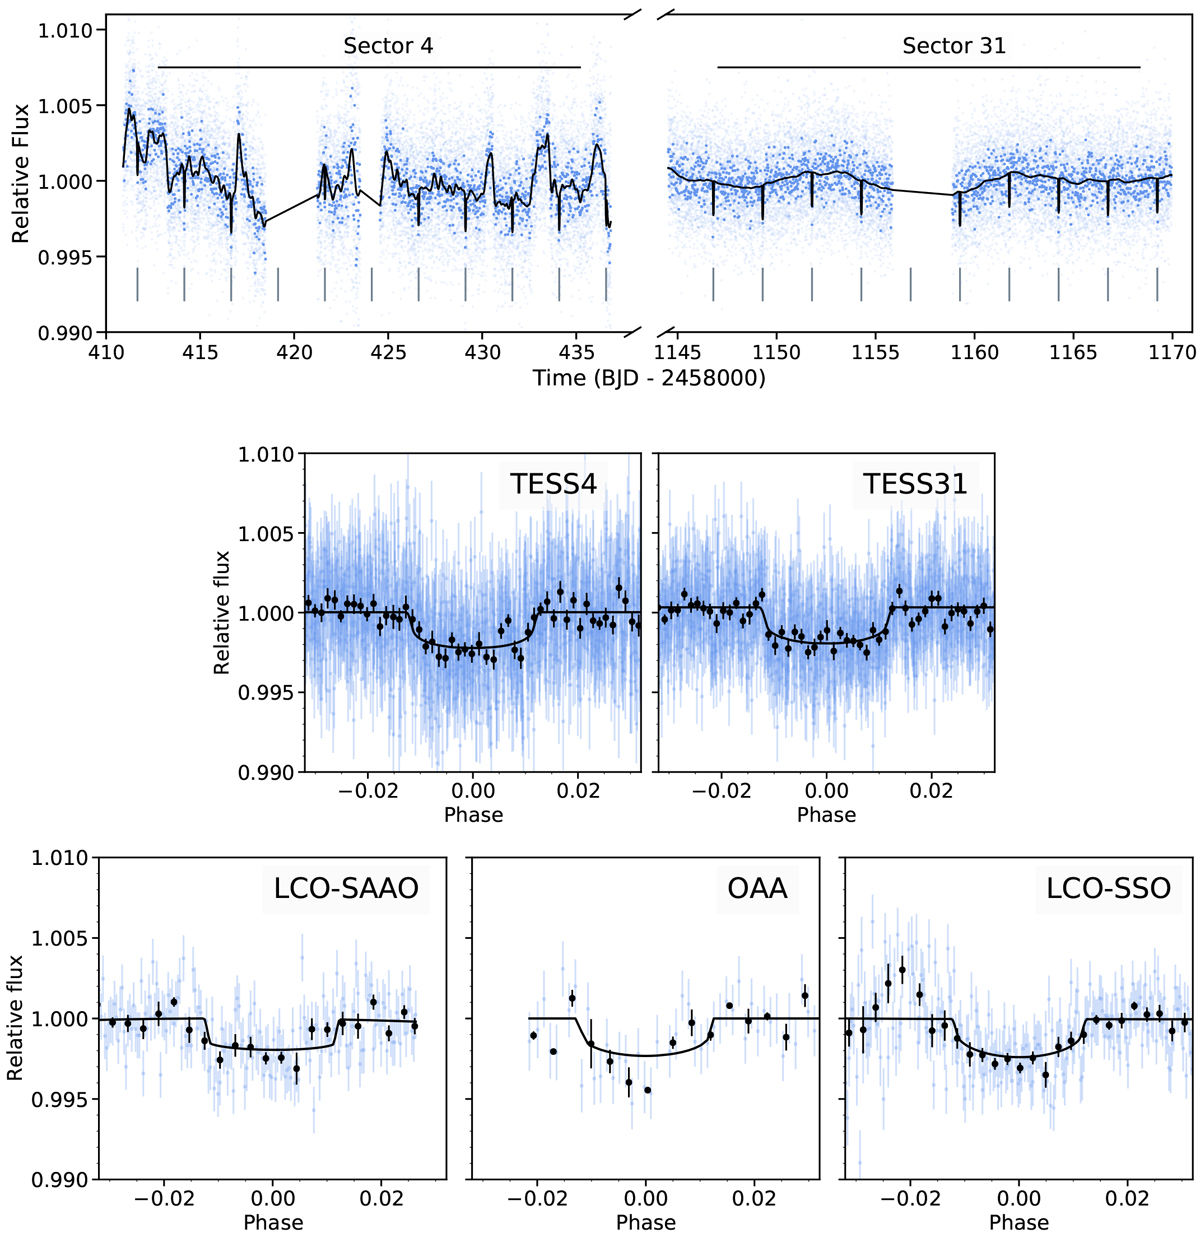
Top panel: full TESS photometry for TOI-1201 from sectors 4 and 31. The opaque and black dots are the data binned to 20 min in the light curve time series and phase-folded plots, respectively. The vertical gray lines represent the transit times, and the black line is the juliet best-fit model from the joint fit. Middle and bottom panels: phase-folded transits for TOI-1201 b for all photometric instruments: TESS sector 4 (middle left) and sector 31 (middle right), LCO-SAAO g′ band (bottom left), OAA V band (bottom middle), and LCO-SSO zs band (bottom right). Any GP components and linear trends were subtracted out before the curves were phase-folded.
Current usage metrics show cumulative count of Article Views (full-text article views including HTML views, PDF and ePub downloads, according to the available data) and Abstracts Views on Vision4Press platform.
Data correspond to usage on the plateform after 2015. The current usage metrics is available 48-96 hours after online publication and is updated daily on week days.
Initial download of the metrics may take a while.