Fig. D.2
Download original image
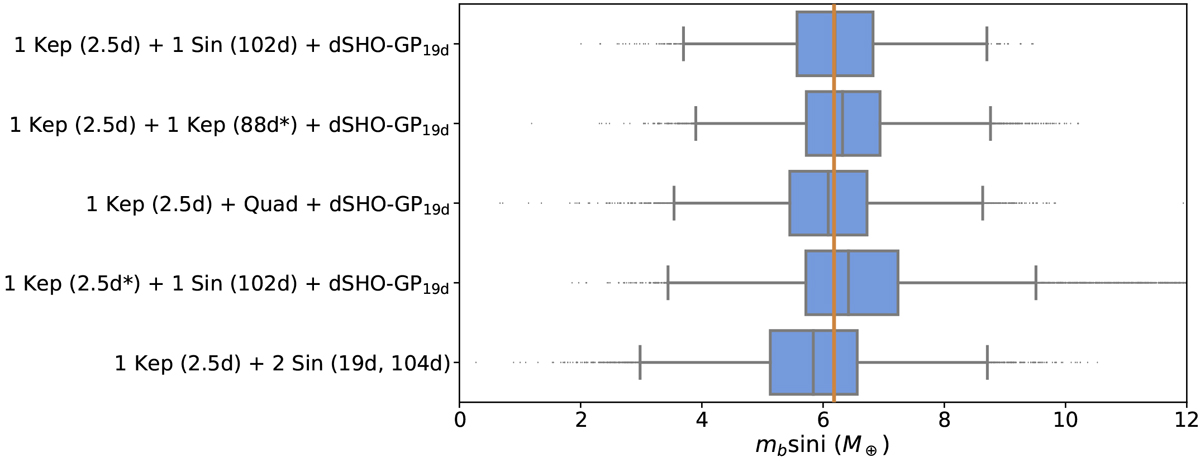
Posteriors of the minimum mass of the 2.5 d transiting planet around TOI-1201 depending on the model choice for the RV-only fits. The vertical orange line is the median value corresponding to the 1 Kep (2.5 d) + 1 Sin (102 d) + dSHO-GP19d model (top). The 25 % and 75 % quartiles are represented as the blue box, the extending black lines show the rest of the distribution,and the dots are considered “outliers.” The model names correspond to those in Table 4.
Current usage metrics show cumulative count of Article Views (full-text article views including HTML views, PDF and ePub downloads, according to the available data) and Abstracts Views on Vision4Press platform.
Data correspond to usage on the plateform after 2015. The current usage metrics is available 48-96 hours after online publication and is updated daily on week days.
Initial download of the metrics may take a while.