Fig. A.1
Download original image
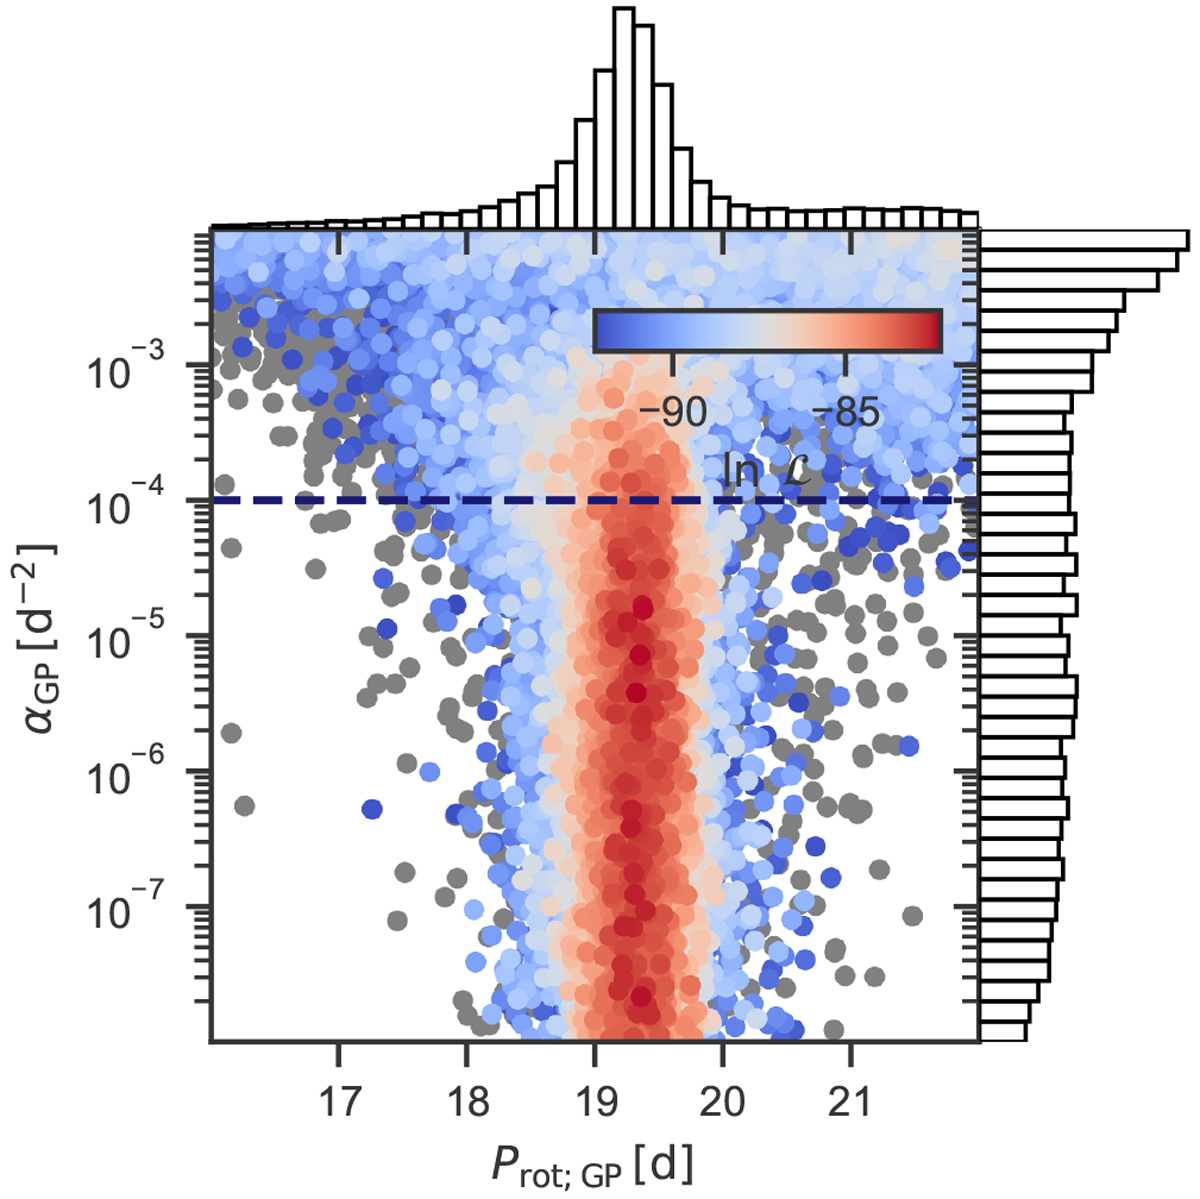
Posterior distribution of the GP parameters for α and Prot for an RV-only run, including a QP-GP centered on the rotational period ~19 d and using anunconstrained prior on α. Samples are color-coded in accordance to their log-likelihood values, where those with a Δ ln L > 10 compared to the best solution are colored gray. The horizontal dashed line represents the maximum value at which we constrained the α parameter in order to exclude the plateau-like behavior. The plot is inspired by Stock et al. (2020b).
Current usage metrics show cumulative count of Article Views (full-text article views including HTML views, PDF and ePub downloads, according to the available data) and Abstracts Views on Vision4Press platform.
Data correspond to usage on the plateform after 2015. The current usage metrics is available 48-96 hours after online publication and is updated daily on week days.
Initial download of the metrics may take a while.