Fig. 1
Download original image
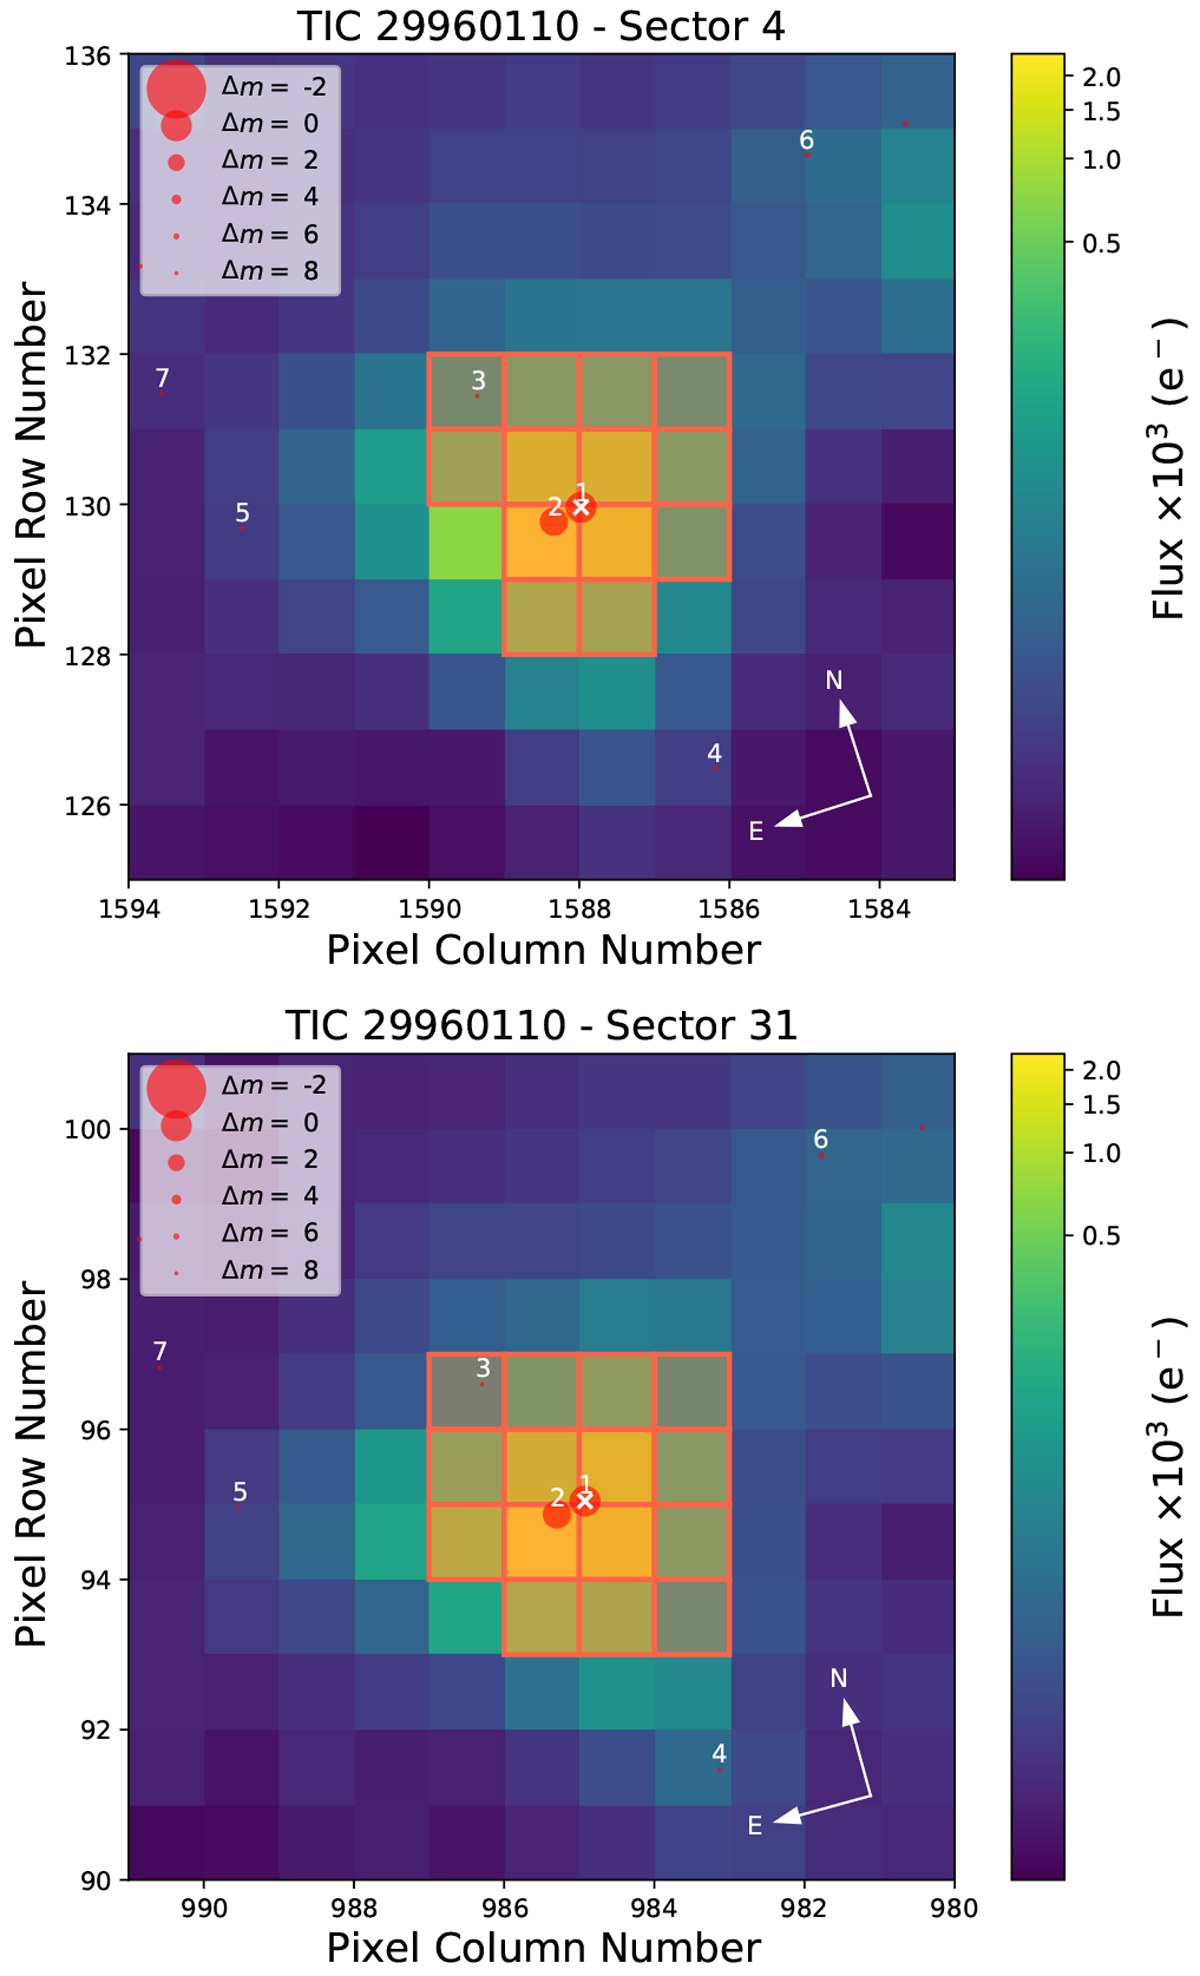
TESS TPF plot for TOI-1201 for sectors 4 and 31. The SAP was computed using the flux counts coming in from the red bordered pixels (mask). The red circles represent neighboring sources listed in Gaia DR2, where the size corresponds to the brightness difference with respect to TOI-1201. The close companion to TOI-1201 is indicated as source #2.
Current usage metrics show cumulative count of Article Views (full-text article views including HTML views, PDF and ePub downloads, according to the available data) and Abstracts Views on Vision4Press platform.
Data correspond to usage on the plateform after 2015. The current usage metrics is available 48-96 hours after online publication and is updated daily on week days.
Initial download of the metrics may take a while.