Open Access
Fig. 9.
Download original image
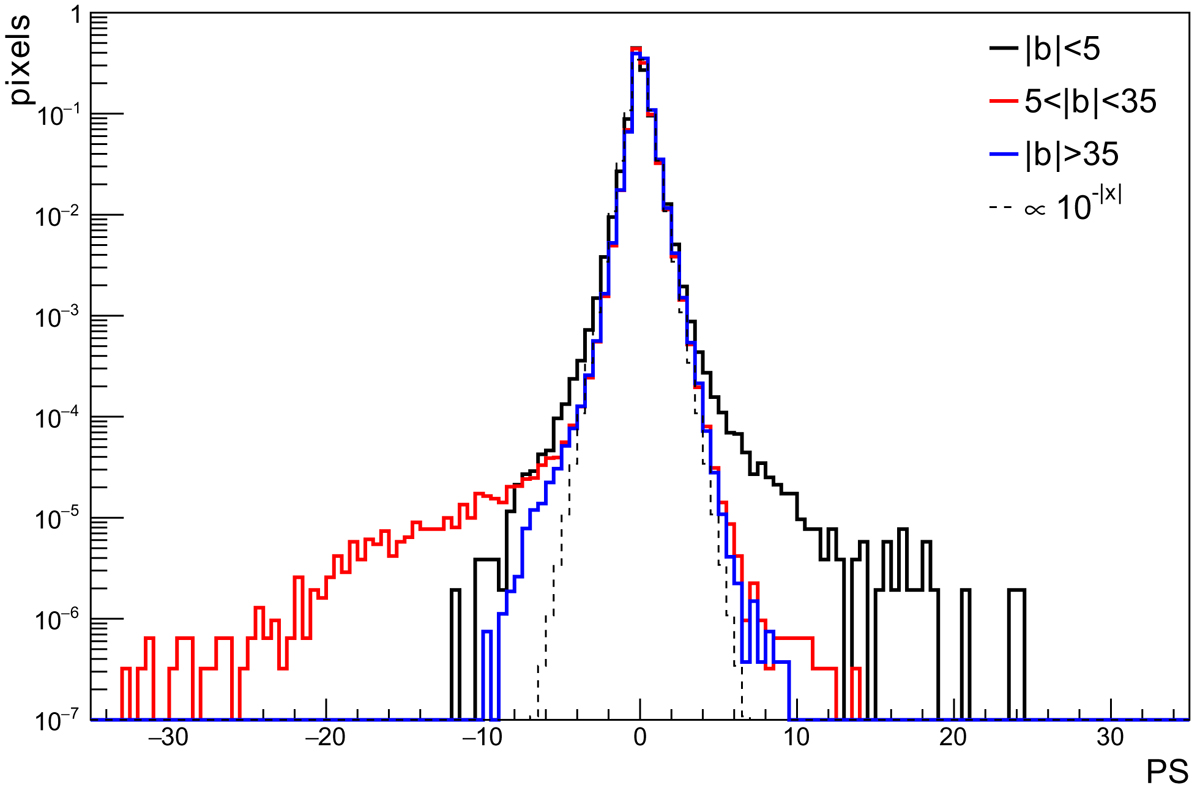
PS distribution obtained in the verification of the 4FGL-DR2 catalog (10 years of data) for the three Galactic latitude selections. The thin solid histogram corresponds to the expected 10−|x| distribution. All histograms are normalized such that their integral is 1.
Current usage metrics show cumulative count of Article Views (full-text article views including HTML views, PDF and ePub downloads, according to the available data) and Abstracts Views on Vision4Press platform.
Data correspond to usage on the plateform after 2015. The current usage metrics is available 48-96 hours after online publication and is updated daily on week days.
Initial download of the metrics may take a while.