Fig. 6.
Download original image
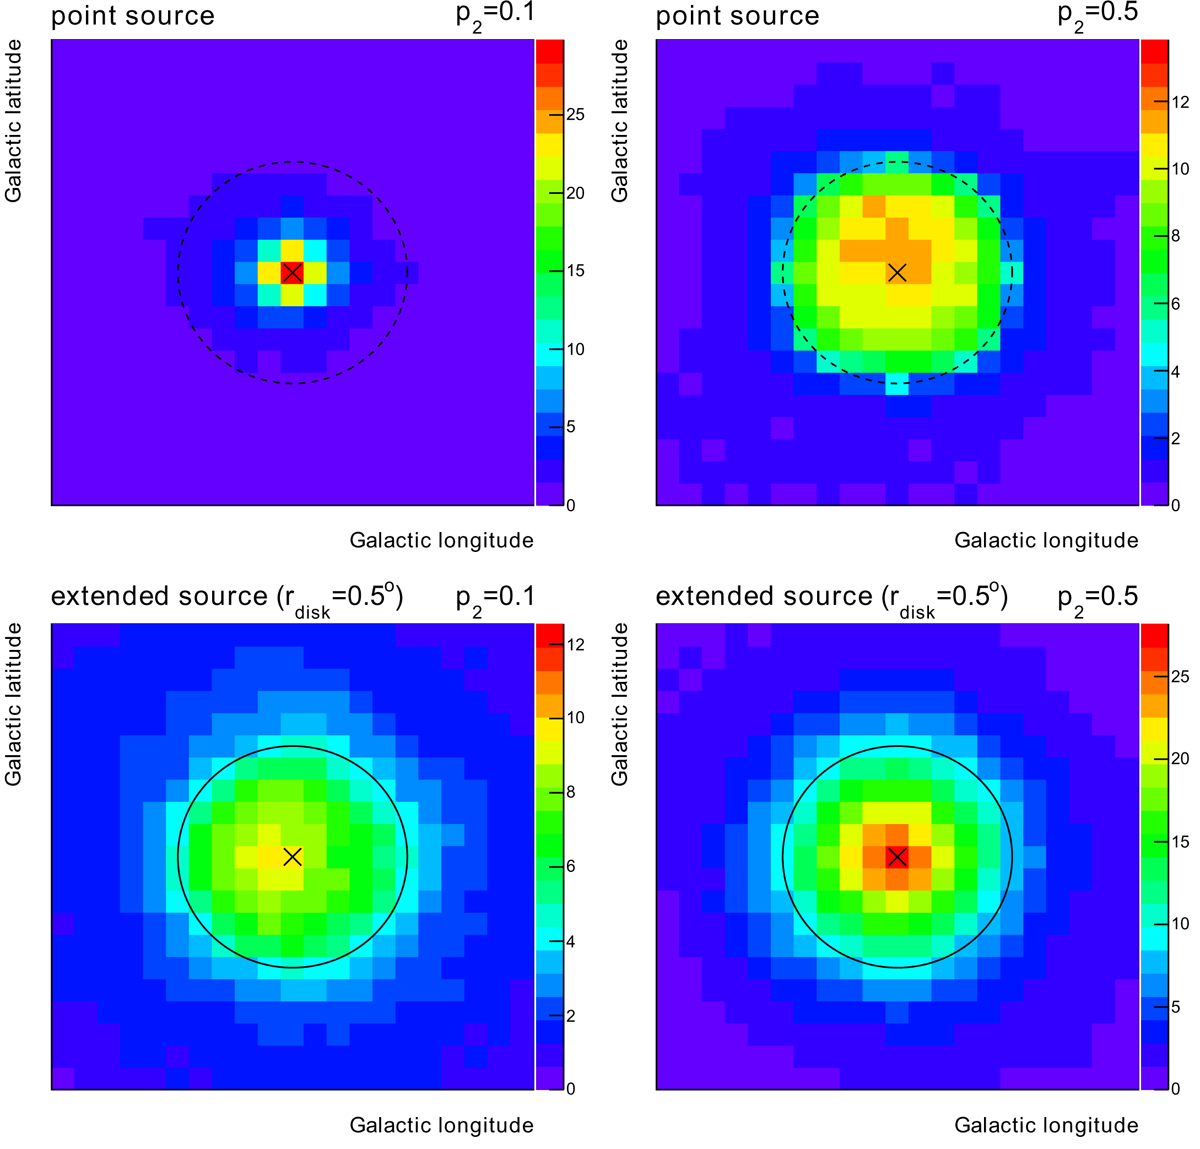
2° ×2° region of the average PS map around the simulated source for a point-like source (top) and an extended source (bottom), whose spatial model is a uniform disk with a 0.5° radius. The PS is computed with p2 = 0.1 (left) and 0.5 (right). The pixel size is 0.1° and the radius of the superimposed circle is 0.5°. The cross indicates the position of the simulated source.
Current usage metrics show cumulative count of Article Views (full-text article views including HTML views, PDF and ePub downloads, according to the available data) and Abstracts Views on Vision4Press platform.
Data correspond to usage on the plateform after 2015. The current usage metrics is available 48-96 hours after online publication and is updated daily on week days.
Initial download of the metrics may take a while.