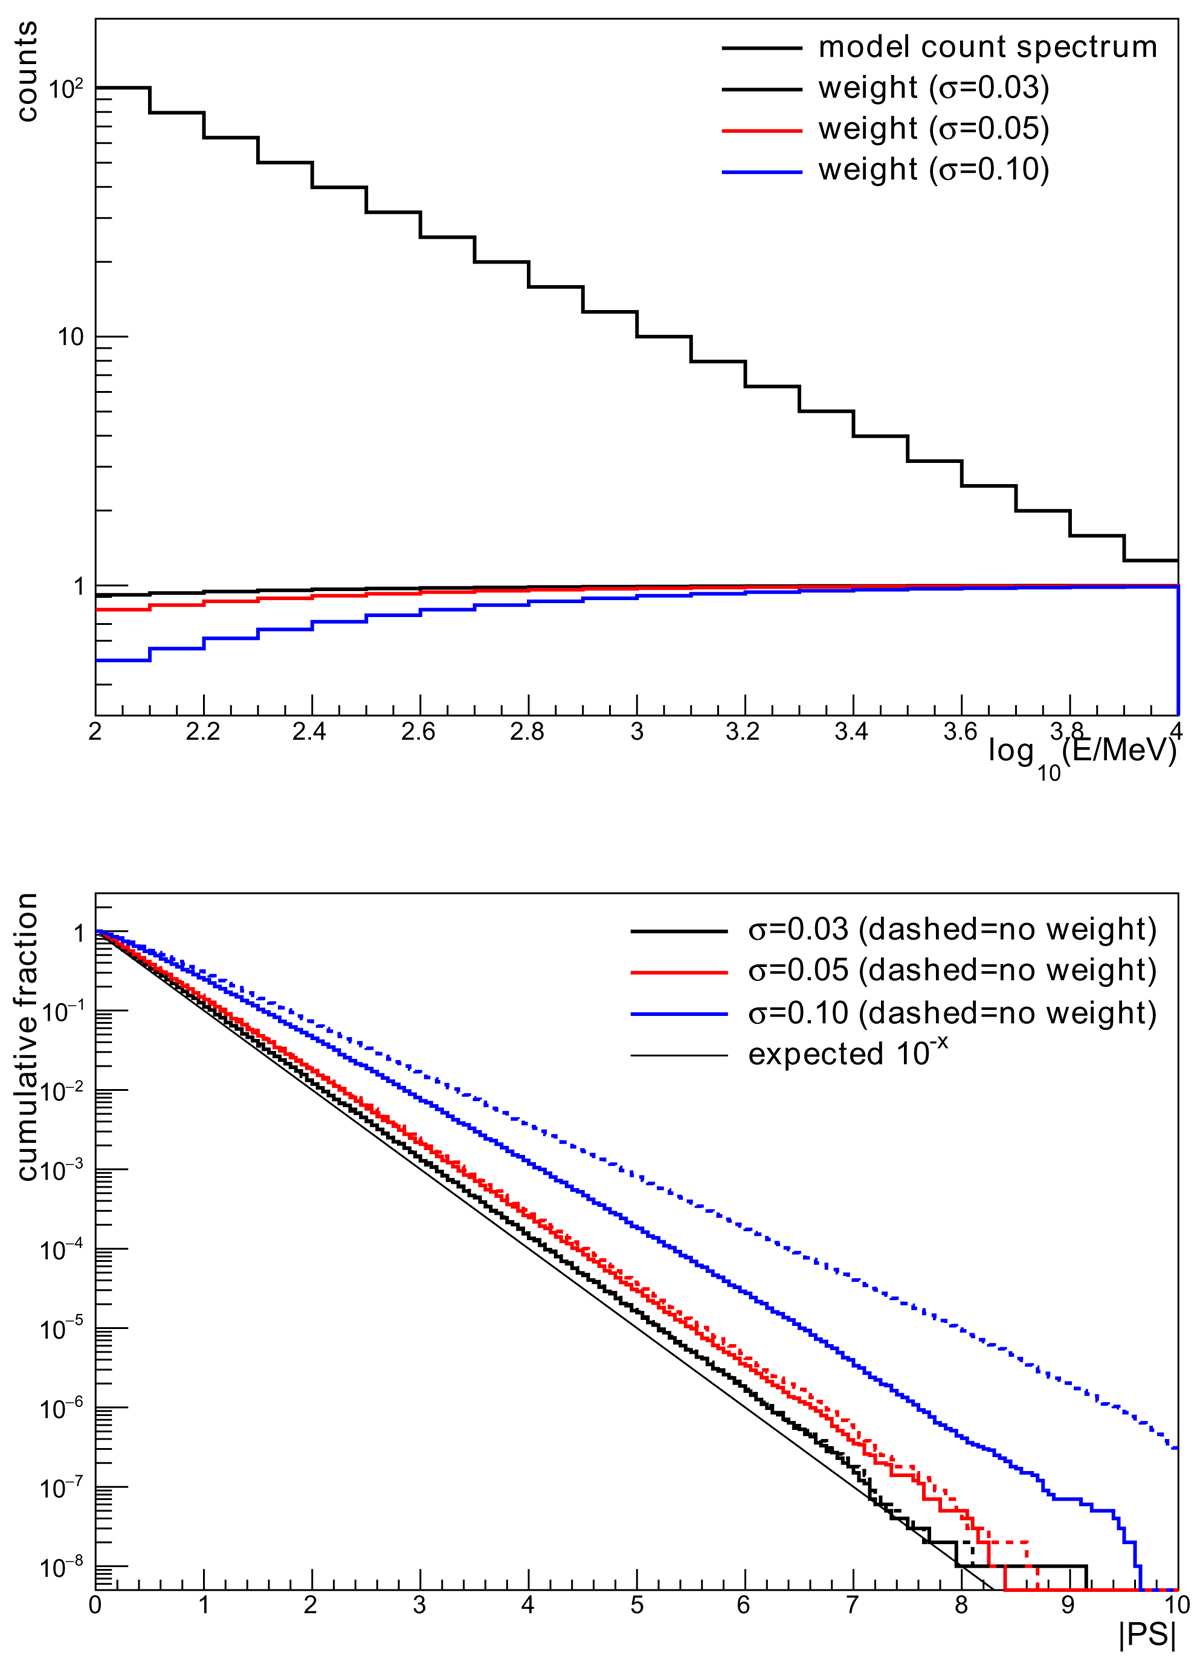
Fig. C.1.
Download original image
Simulations to test the use of likelihood weights to handle systematic uncertainty: count spectrum and average weights (top) and PS CCDF as a function of |PS| (bottom). The three levels of systematic uncertainty are 3, 5 and 10%. The solid and dashed histograms correspond to the weighted and unweighted PS, respectively. The expected 10−x distribution is also shown (thin solid line).
Current usage metrics show cumulative count of Article Views (full-text article views including HTML views, PDF and ePub downloads, according to the available data) and Abstracts Views on Vision4Press platform.
Data correspond to usage on the plateform after 2015. The current usage metrics is available 48-96 hours after online publication and is updated daily on week days.
Initial download of the metrics may take a while.