Fig. 1.
Download original image
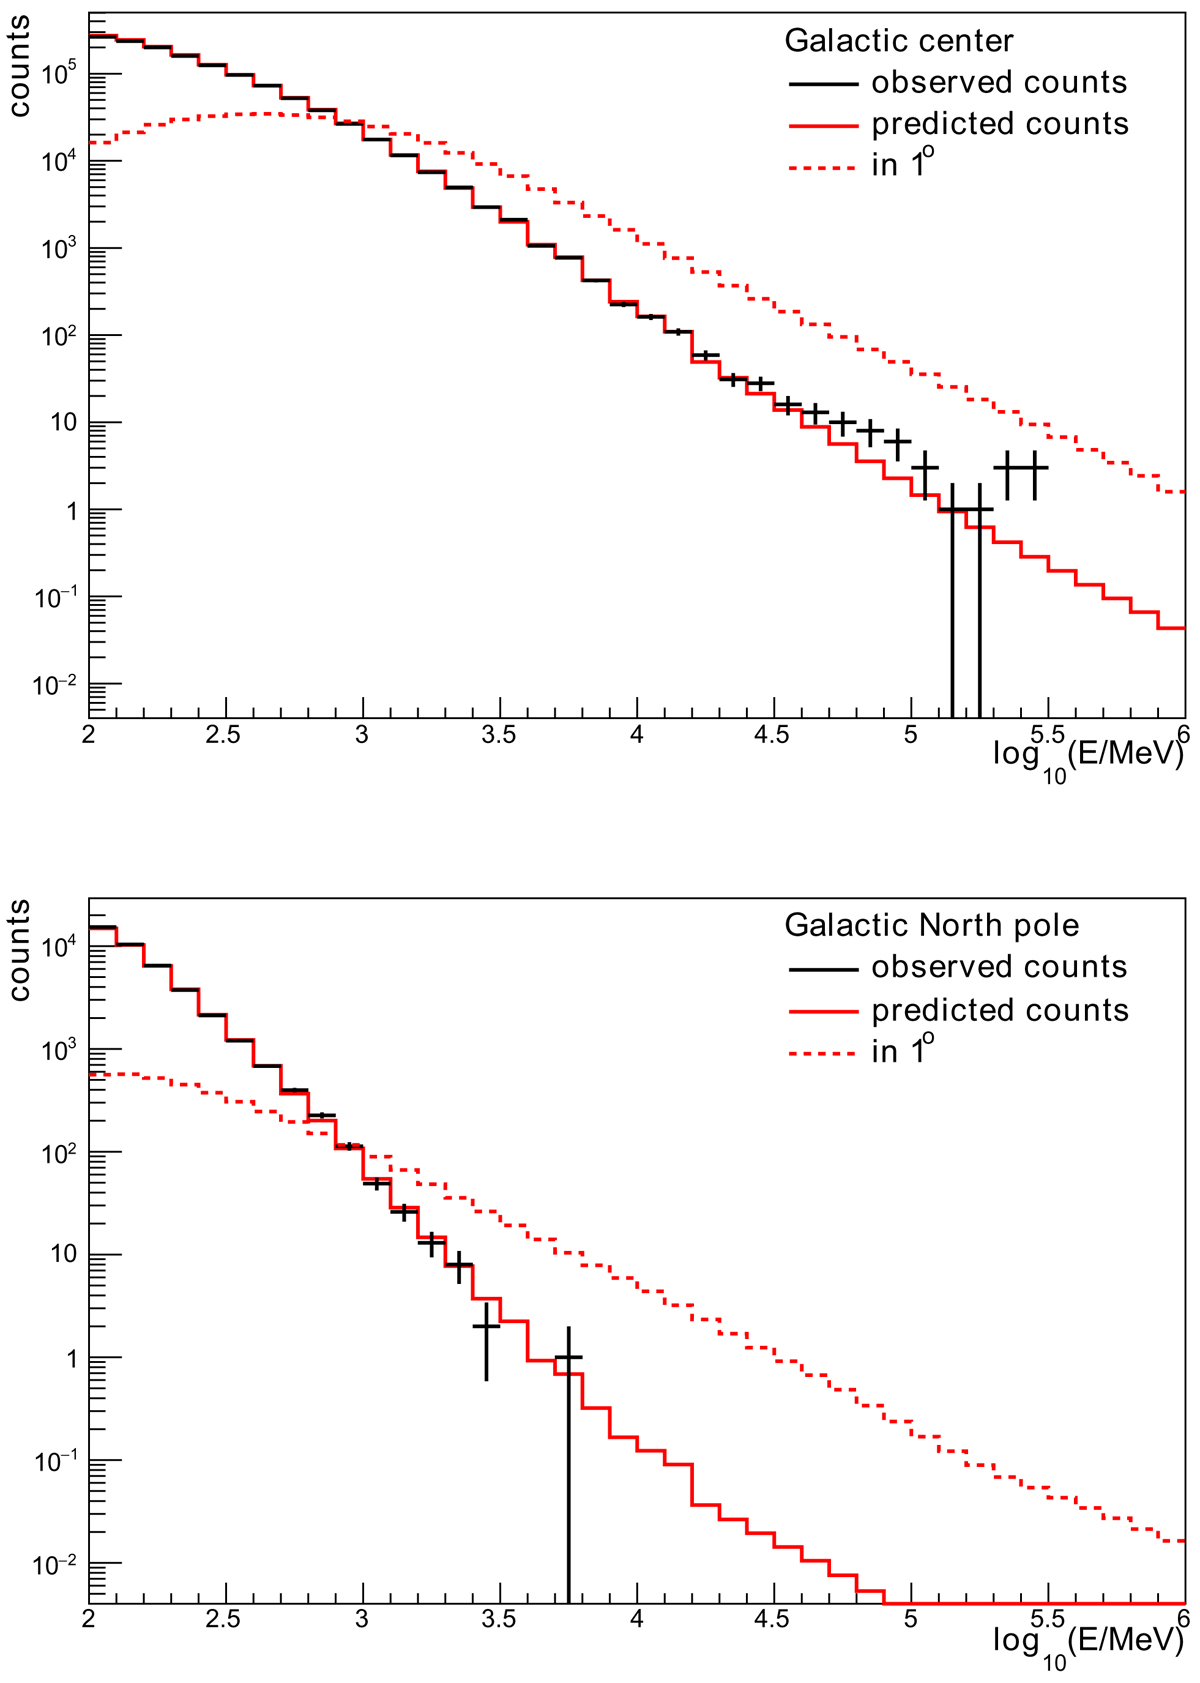
PSF 68% integrated count spectra at the center pixel of the RoIs centered on the Galactic center (top) and the Galactic North pole (bottom) for data (black) and model (red). The dashed red line shows for comparison the model count spectra integrated over 1°. The average likelihood weights, introduced in Sect. 4, are also shown.
Current usage metrics show cumulative count of Article Views (full-text article views including HTML views, PDF and ePub downloads, according to the available data) and Abstracts Views on Vision4Press platform.
Data correspond to usage on the plateform after 2015. The current usage metrics is available 48-96 hours after online publication and is updated daily on week days.
Initial download of the metrics may take a while.