Fig. B.1
Download original image
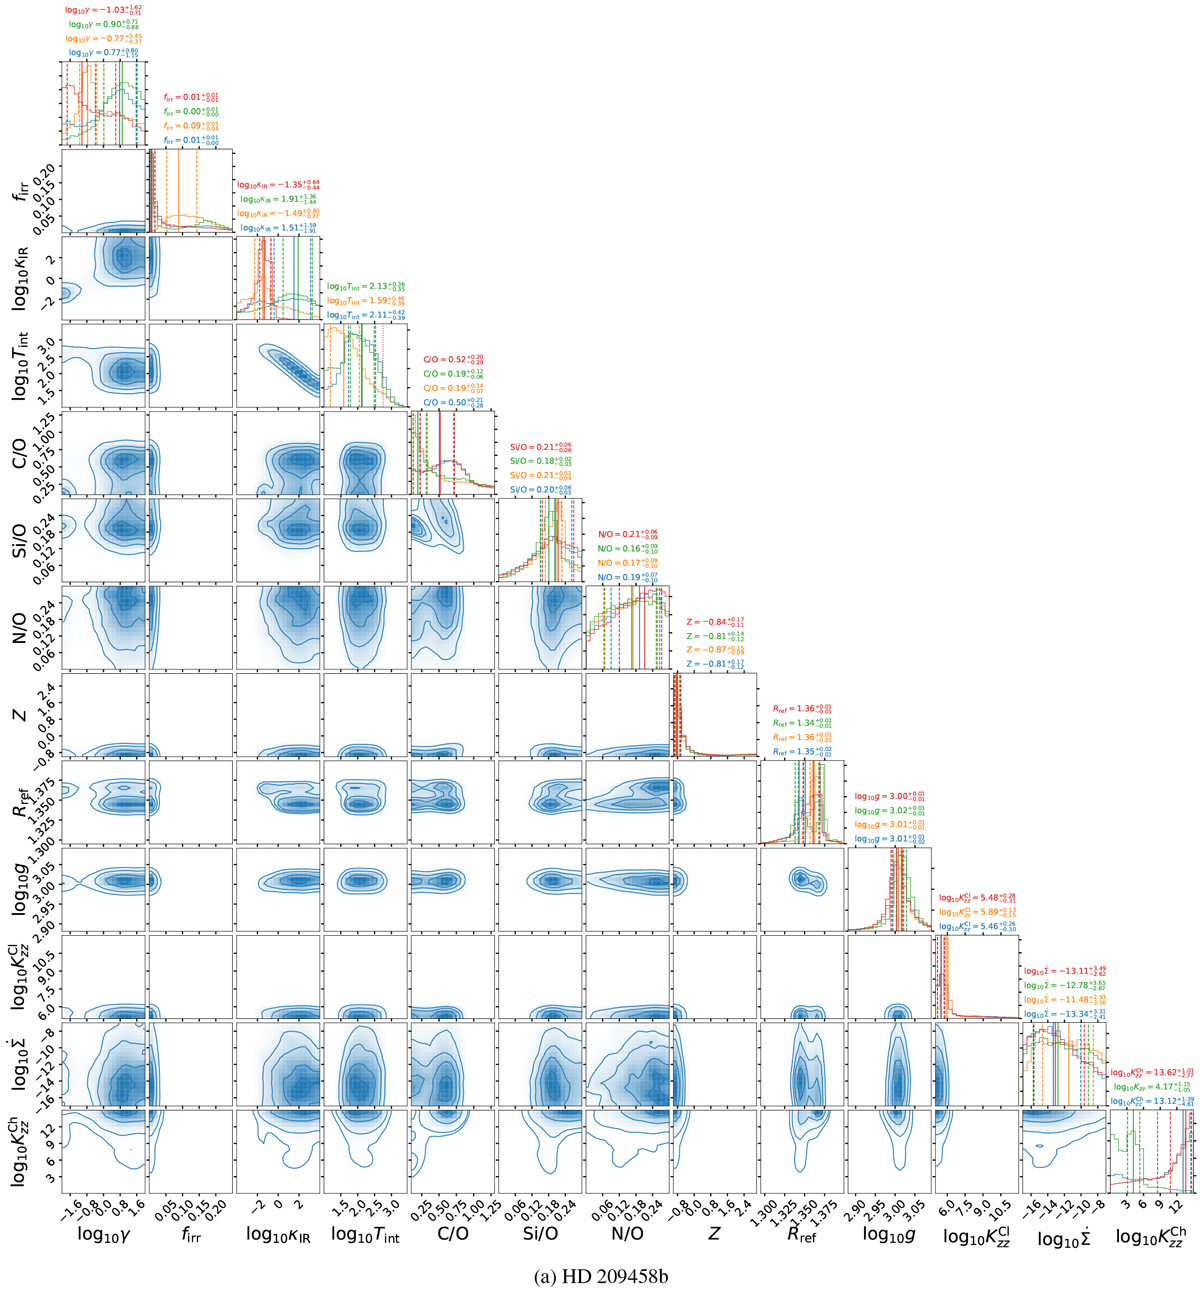
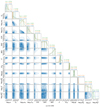
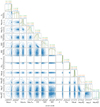
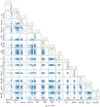
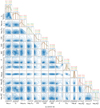
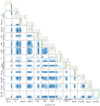
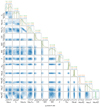
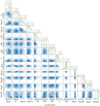
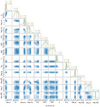
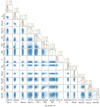
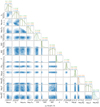
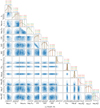
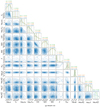
Corner plots for the standard disequilibrium retrieval (blue). Also shown in the posterior probability distributionplots are the results of the equilibrium retrieval (orange) and disequilibrium retrievals with the same Kzz (green) and with fixed Tint (red; only shown for planets with masses larger than half Jupiter mass). The vertical solid and dashed lines in the posterior plots indicate the median value and the 1σ confidence interval for each parameter, respectively. Kzz retrieved from the same-Kzz retrieval is shown in the place of ![]() , and the vertical red dotted line in the posterior plot of log10Tint is the value assumed in the Tint-fixed retrieval. The unit for each parameter is the same as that used in Table 2.
, and the vertical red dotted line in the posterior plot of log10Tint is the value assumed in the Tint-fixed retrieval. The unit for each parameter is the same as that used in Table 2.
Current usage metrics show cumulative count of Article Views (full-text article views including HTML views, PDF and ePub downloads, according to the available data) and Abstracts Views on Vision4Press platform.
Data correspond to usage on the plateform after 2015. The current usage metrics is available 48-96 hours after online publication and is updated daily on week days.
Initial download of the metrics may take a while.