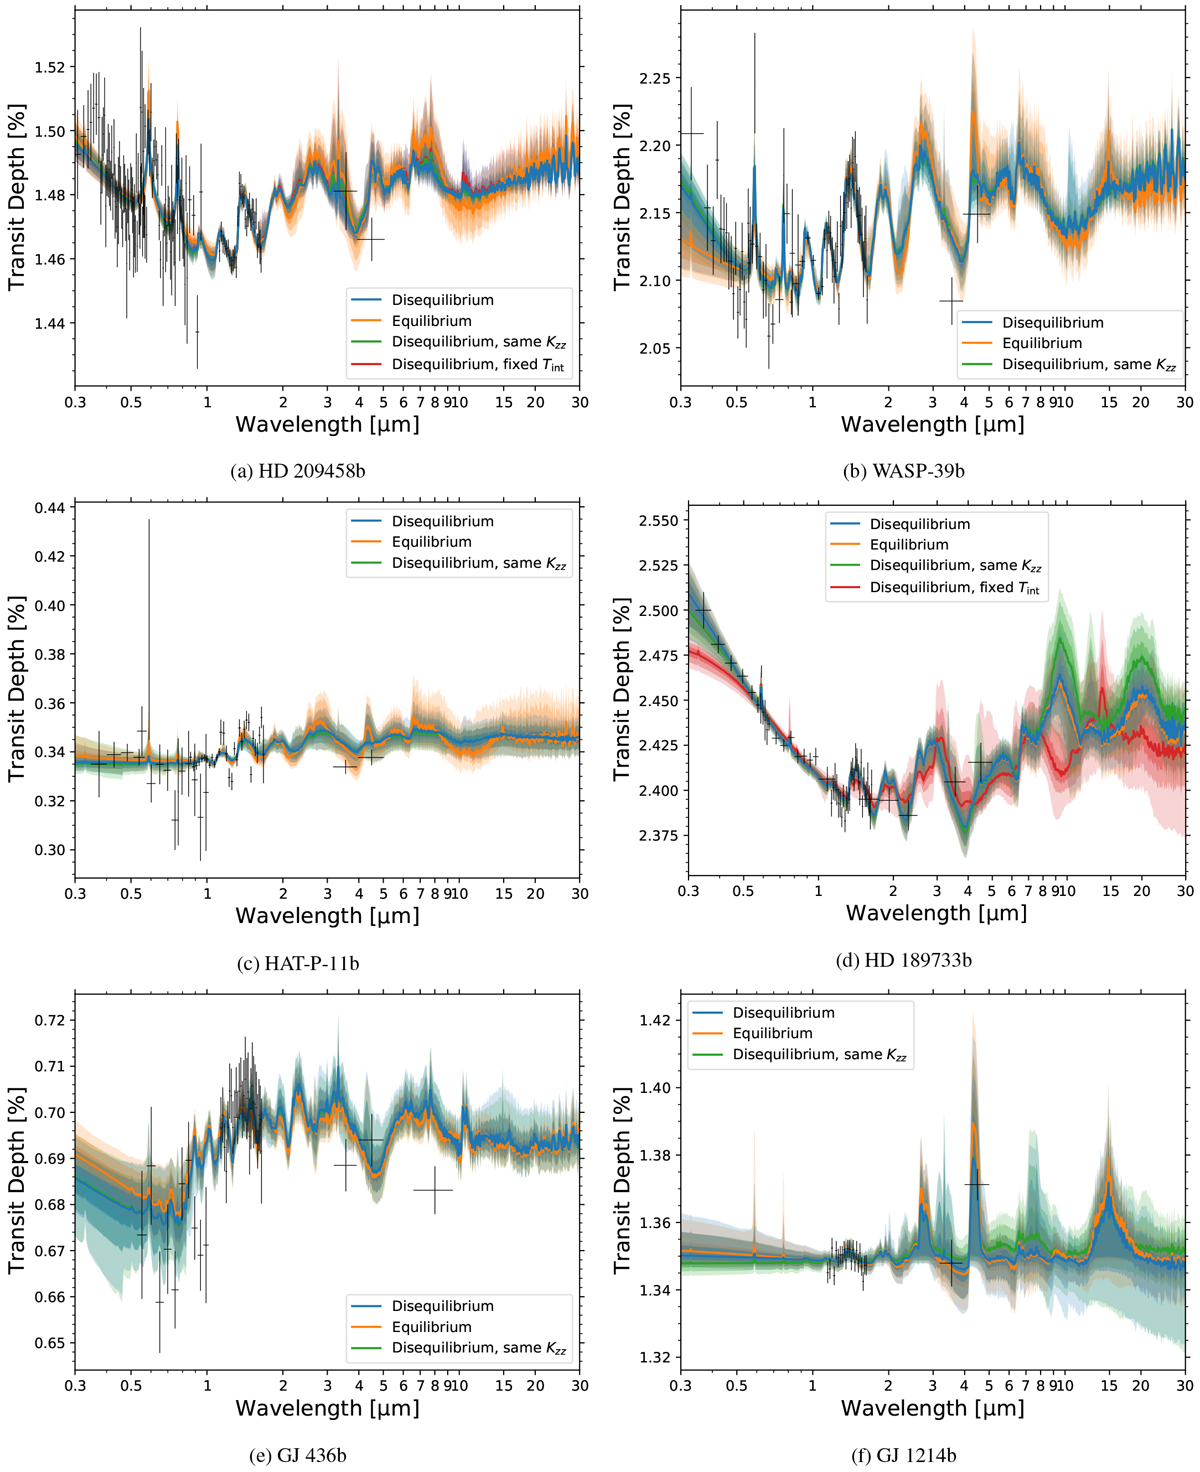
Fig. 1
Download original image
Transmission spectra retrieved from the standard disequilibrium retrieval (blue), equilibrium retrieval (orange), and disequilibrium retrievals with the same Kzz (green) and with fixed Tint (red; only shown for planets with masses larger than half Jupiter mass). The solid lines show the median models while the shaded regions indicate the 1, 2, and 3σ confidence intervals. The black points denote the observed data used.
Current usage metrics show cumulative count of Article Views (full-text article views including HTML views, PDF and ePub downloads, according to the available data) and Abstracts Views on Vision4Press platform.
Data correspond to usage on the plateform after 2015. The current usage metrics is available 48-96 hours after online publication and is updated daily on week days.
Initial download of the metrics may take a while.