Fig. 9.
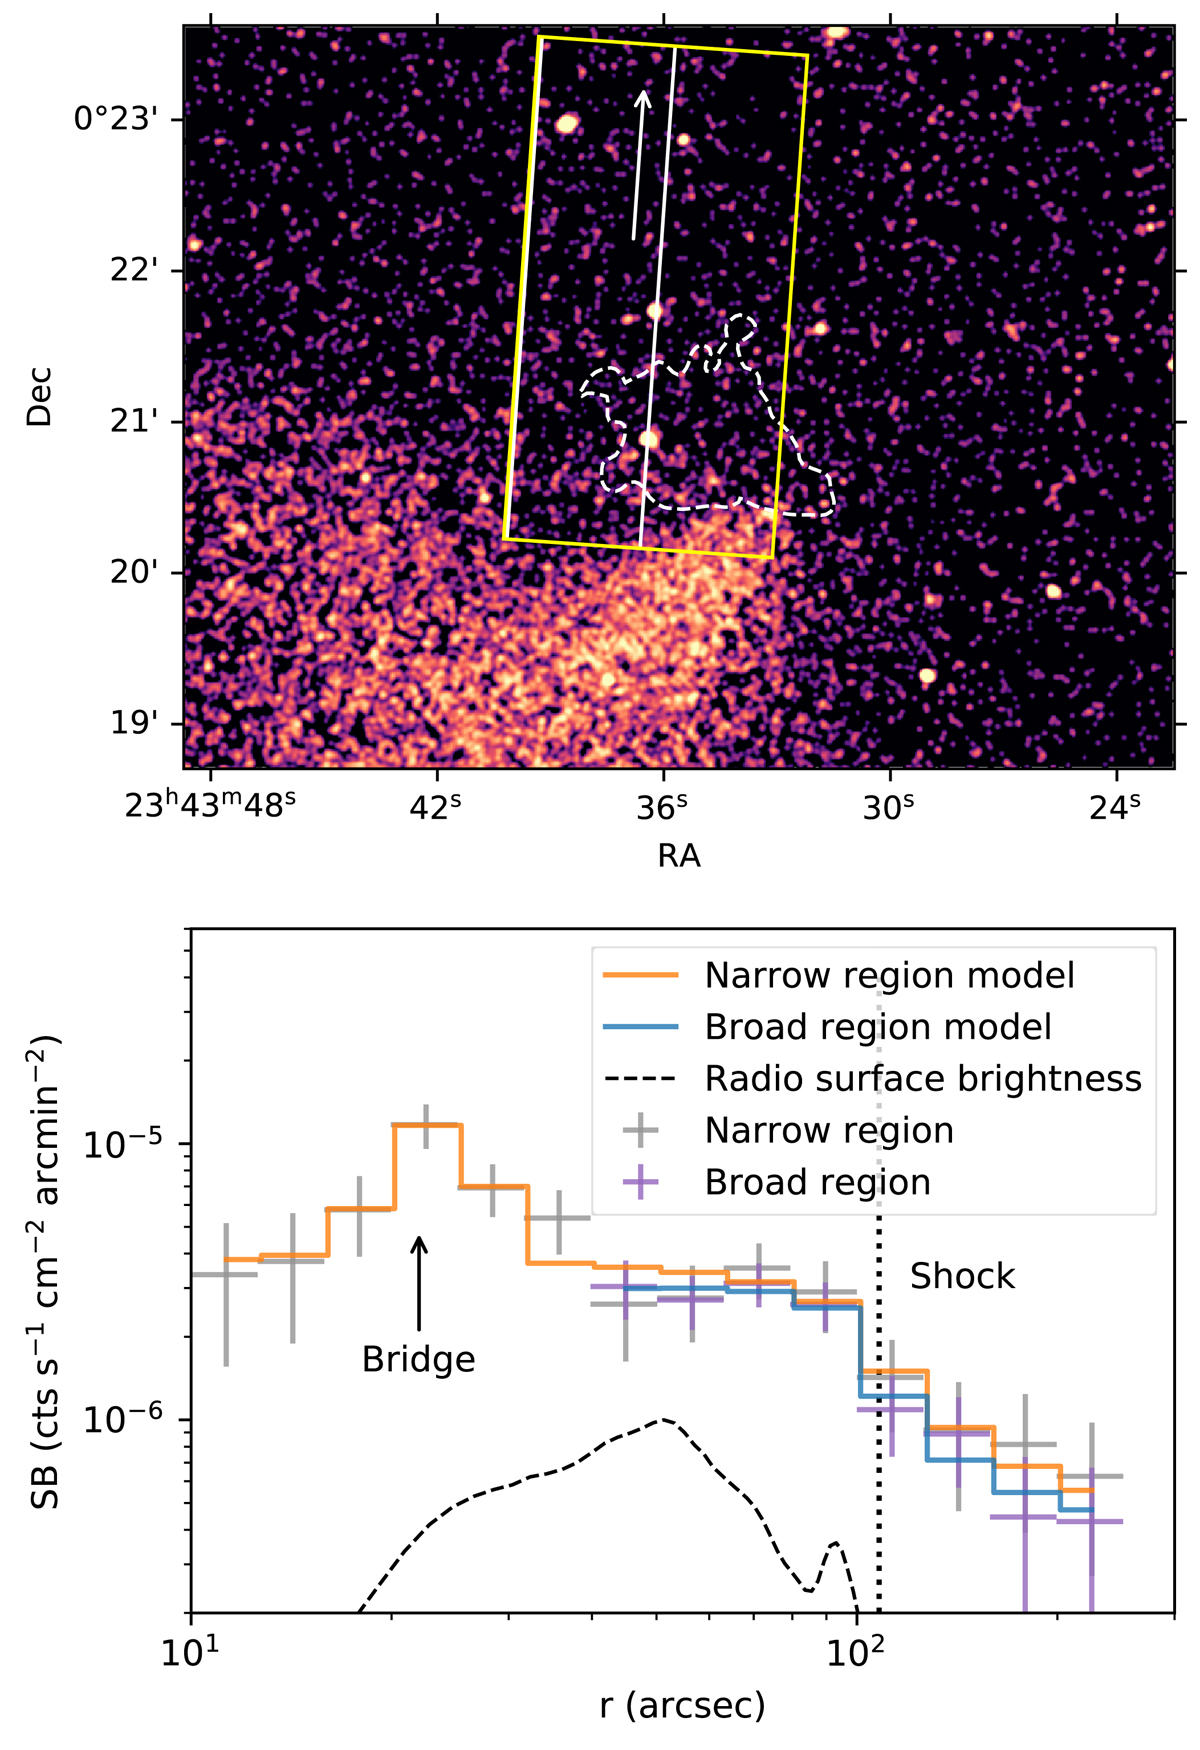
Download original image
Top: narrow (white) and broad (yellow) extraction regions for surface brightness profiles in the northern outskirts. The dashed contour is the northern relic in the GMRT 325 MHz image at the 3σrms level. Bottom: surface brightness profiles and their best-fit model in the narrow and broad regions. The bridge and the surface brightness jump are located at r = 23″ and r = 108″, respectively. The GMRT 325 MHz profile is plotted with a dashed curve, the outer edge of which is associated with the potential X-ray jump.
Current usage metrics show cumulative count of Article Views (full-text article views including HTML views, PDF and ePub downloads, according to the available data) and Abstracts Views on Vision4Press platform.
Data correspond to usage on the plateform after 2015. The current usage metrics is available 48-96 hours after online publication and is updated daily on week days.
Initial download of the metrics may take a while.